OUR 9TH YEAR OF PROVIDING PROPRIETARY CAPITAL MARKETS INTELLIGENCE ON THE CANNABIS / HEMP / PSYCHEDELIC SECTORS
Credit ratings are not currently available for public cannabis companies leaving companies, lenders and investors with a gap of information. The Viridian Cannabis Credit Tracker fills this gap. The model uses 11 market and financial statement variables to discern 4 key credit factors: Liquidity, Leverage, Profitability, and Size, to provide credit/liquidity analysis for over 370 public Cannabis/Hemp companies.
Weekly Sector Credit – Cultivation and Retail
-
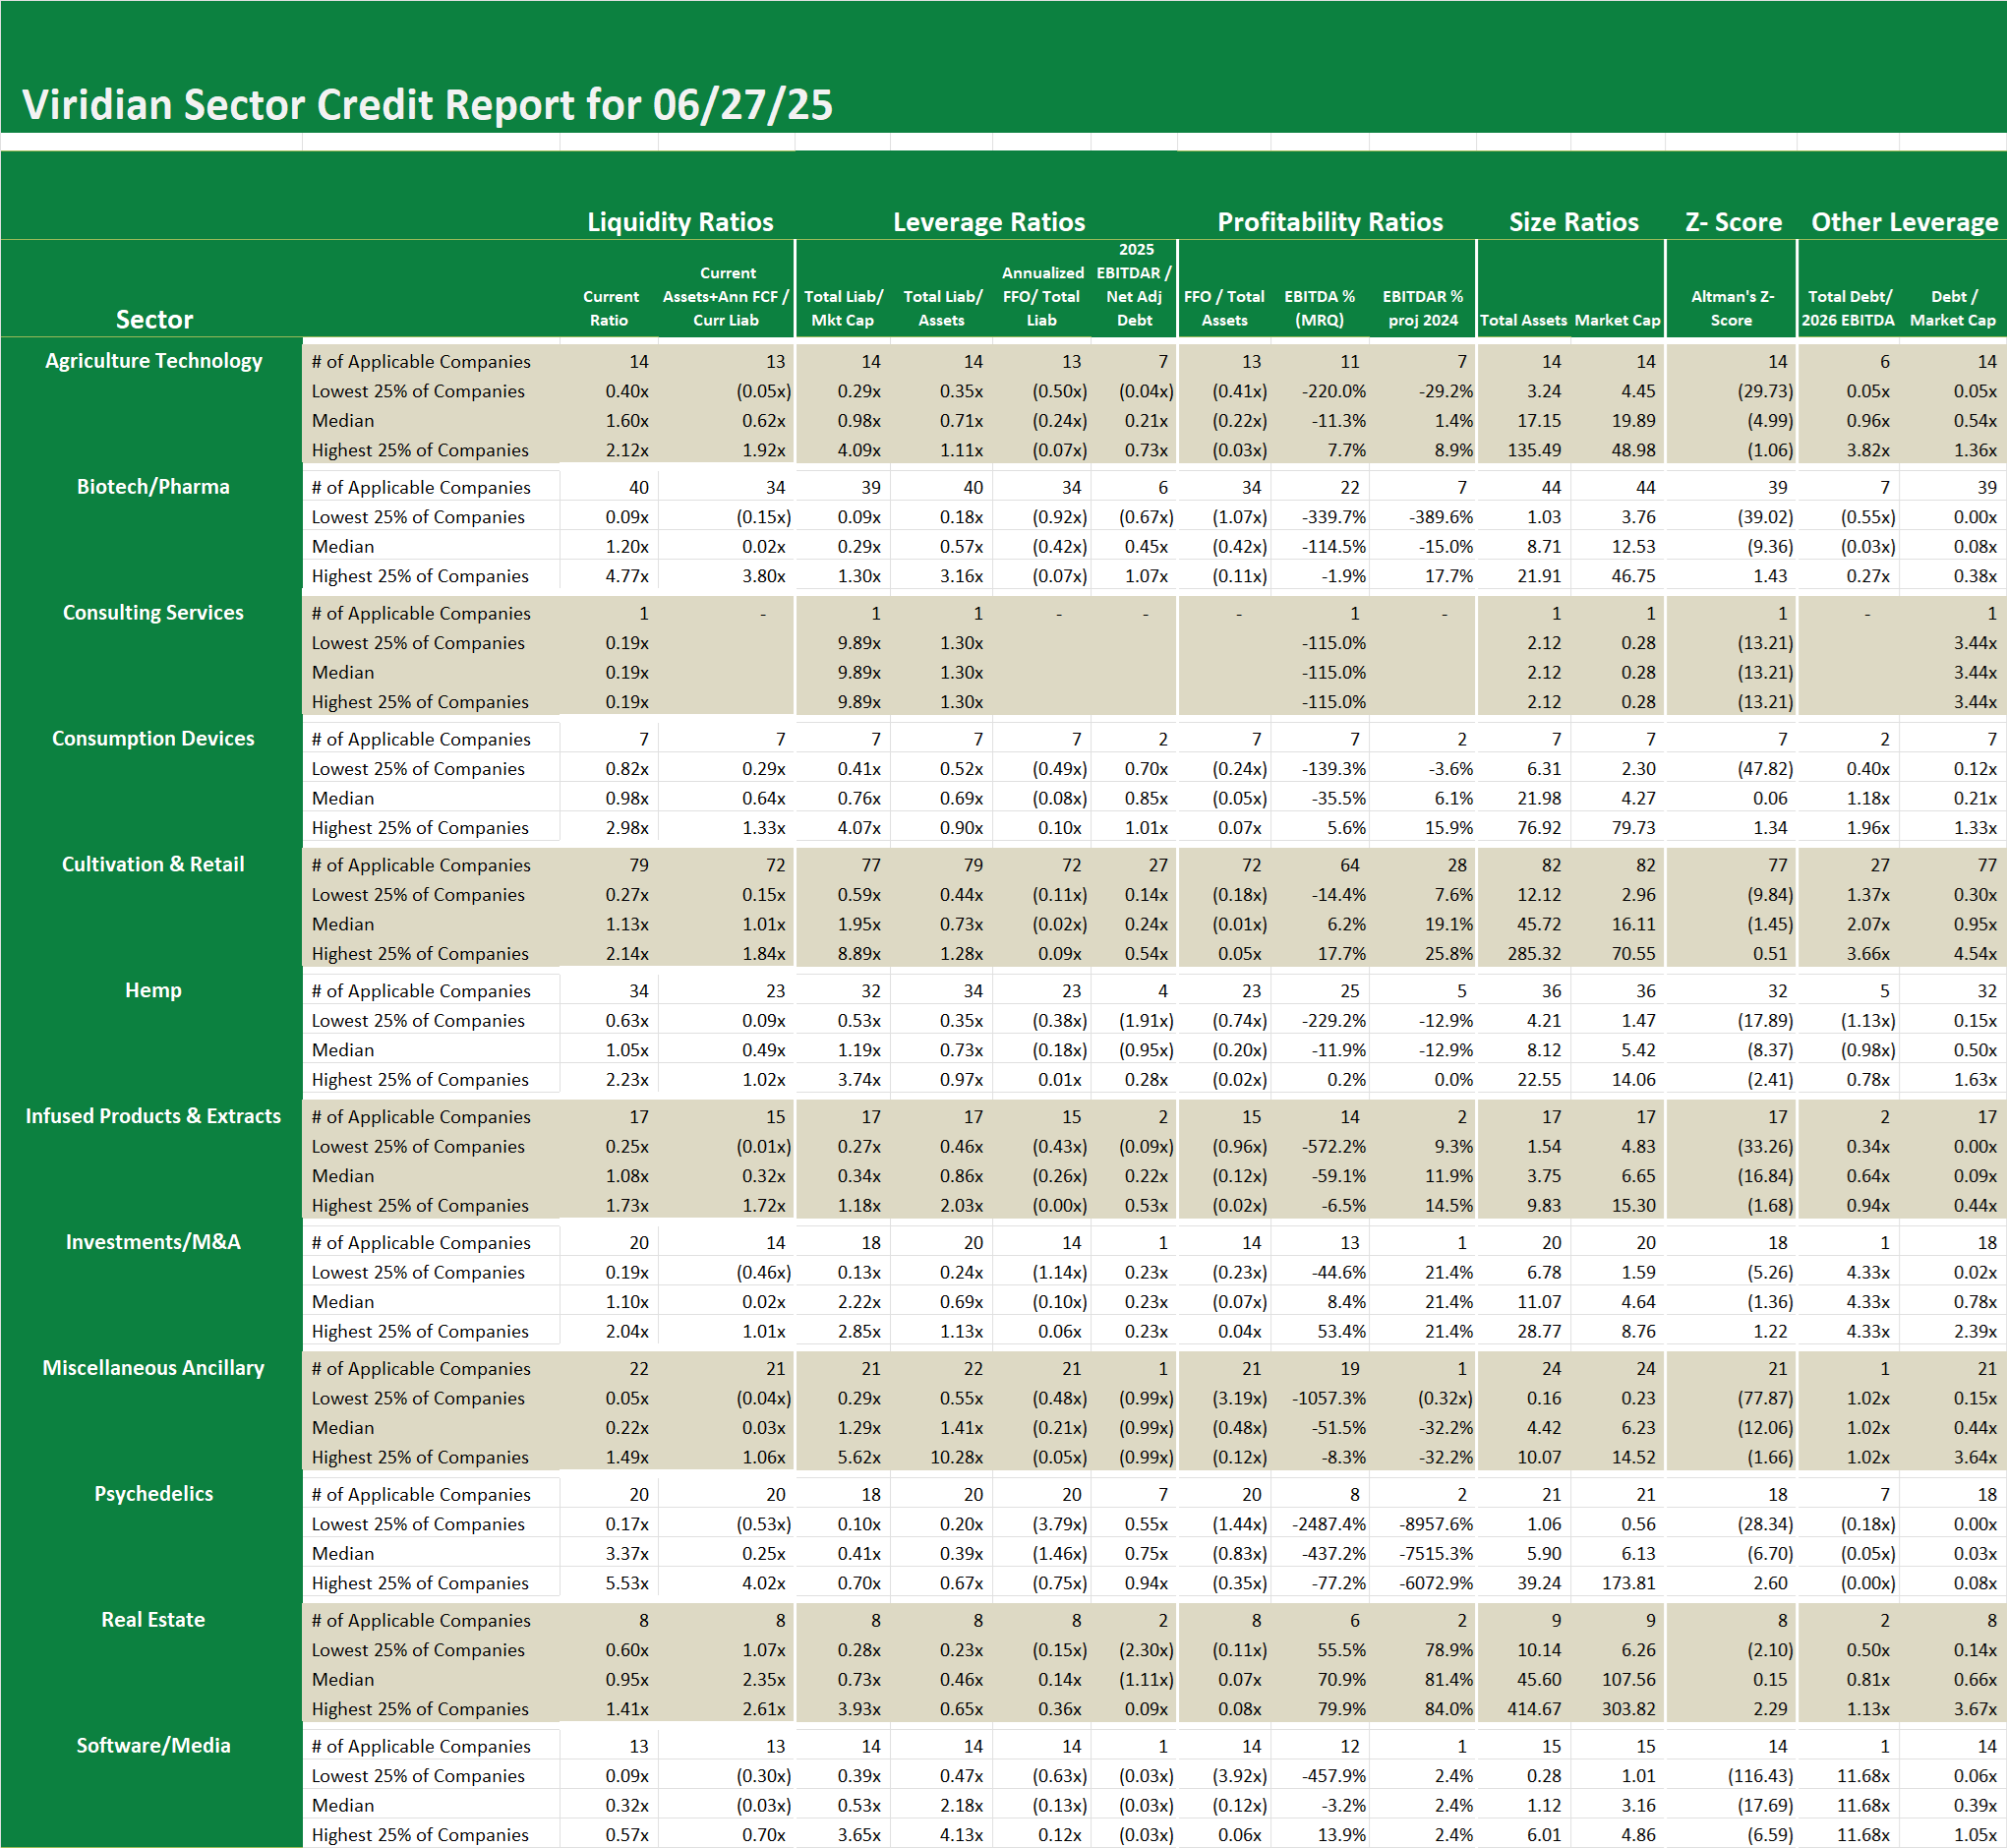
- We have shifted the focus of our Debt/EBITDA credit ratios to projected 2026 results rather than 2025. The results are significantly more positive, as one would expect given the uptick in MSO results that the consensus analyst opinions embody. Median Debt to 2026 EBITDA is only 2.07x for the group, a number that is acceptable even in a 280E environment. The catch, of course, is that the revenue and margins are less certain than those in 2025. Our justification for this longer view is that we have ratios that are geared to shorter periods, such as annualized funds from operations to liabilities in our model, which offset the use of 2026 EBITDA.
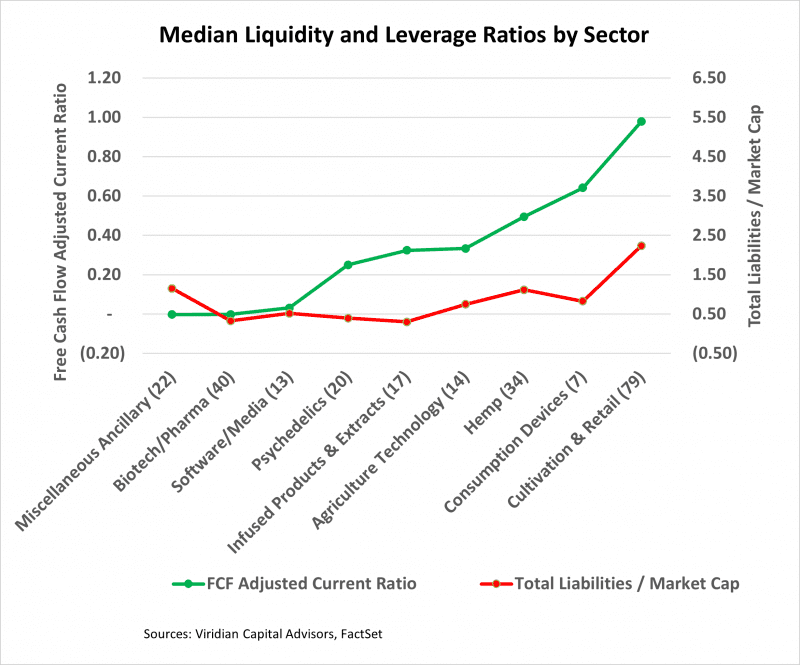
- The total liabilities to market cap ratio of 1.95x continues to indicate market-implied asset value coverage of debt of over 1.2x.
- Liquidity remains the Achilles heel of the sector. The free cash flow-adjusted current ratio of 1.01x suggests that around 50% of the sector’s participants will require additional funding to discharge their short-term liabilities. Not the best position to be in when the capital markets remain tight.
- See the Viridian Credit Sector Report for more details.
Weekly Sector Credit – Cultivation and Retail
-
- We have shifted the focus of our Debt/EBITDA credit ratios to projected 2026 results rather than 2025. The results are significantly more positive, as one would expect given the uptick in MSO results that the consensus analyst opinions embody. Median Debt to 2026 EBITDA is only 2.07x for the group, a number that is acceptable even in a 280E environment. The catch, of course, is that the revenue and margins are less certain than those in 2025. Our justification for this longer view is that we have ratios that are geared to shorter periods, such as annualized funds from operations to liabilities in our model, which offset the use of 2026 EBITDA.
- The total liabilities to market cap ratio of 1.95x continues to indicate market-implied asset value coverage of debt of over 1.2x.
- Liquidity remains the Achilles heel of the sector. The free cash flow-adjusted current ratio of 1.01x suggests that around 50% of the sector’s participants will require additional funding to discharge their short-term liabilities. Not the best position to be in when the capital markets remain tight.
- See the Viridian Credit Sector Report for more details.