Each week, Viridian publishes insights and analysis on completed capital raise transactions in the prior week, focusing on all equity and debt deals. Our analysis includes:
- Summary
- Outlook
- Best & Worst Perfromers
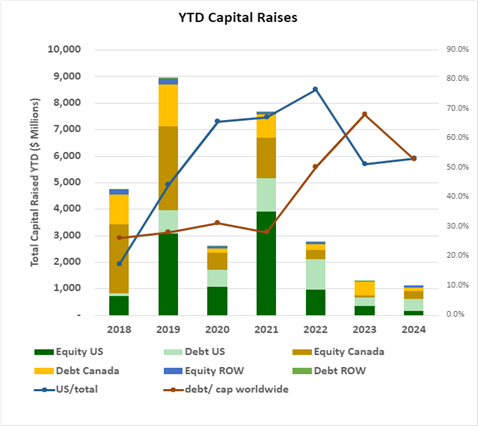
- YTD capital raises totaled $1,143.31M, down 12.6% from the same period in 2023. Debt as a percentage of capital raised dropped to 52.9% from 68.1% in the previous year on a worldwide basis. The U.S. bucked this trend with 73.0% of capital raised in debt compared to 50.6% in 2023.
- U.S. raises accounted for 53.2% of total funds, the lowest percentage since 2019. Conversely, raises from outside the U.S. represented a historically high 8.3% of the total funds raised.
- YTD raises by public companies accounted for 67.8% of total funds, the lowest percentage since before 2018.
VIRIDIAN INSIGHTS
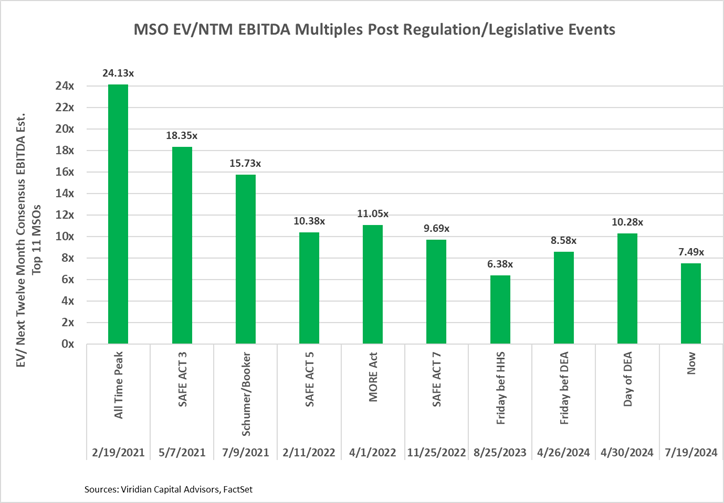
- THE DEA COMMENT PERIOD IS NOW OVER WITH REGARD TO S3. WHAT’S NEXT?
- With approximately 37,000 comments received, it is virtually impossible to guess how long the DEA will take to review the comments, whether any of the comments will lead to hearings, and how long that process might take. We understand that approximately 90% of the comments expressed support for S3.
- We have always suspected that the full rollout of S3 might take longer than expected, and we have not seen much change in our opinion.
- There is certainly a path that says it is all wrapped up and in effect prior to the election. However, the overall equity price levels tell us that rapid timing is far from being the base case. Otherwise, we think we would have seen more improvement.
- Our best advice is to focus on the fundamentals and invest in companies that do not need S3 to achieve positive operating cash flow.
- Still, the graph below shows that dramatic gains are still likely.
- WILL THE PRESIDENTIAL ELECTION DRAMA AND EXPECTED RATIFICATION OF KAMALA HARRIS AS THE DEMOCRATIC CANDIDATE POSITIVELY IMPACT CANNABIS?
- Cannabis stocks are riding a two-day high after the news of Biden’s withdrawal and the presumptive nomination of Kamala Harris.
- The market appears to have fully bought into the notion that Harris would be more favorable for cannabis than Trump.
- Frankly, we do not see a stark difference. Harris’s rhetoric about legalizing cannabis is just that and nothing more. There is no pathway to true legalization in sight, and in practice, we expect nothing much more than the continued push for S3. Perhaps Trump’s ascendancy in the polls following the assassination attempt may lend extra urgency to this push. Still, we do not see Harris as being more effective in this regard than Biden.
- Meanwhile, Trump and his chosen VP have come out as solid State rights advocates on cannabis, and that is about as good as the MSOs are likely to get in the near term.
- Will the election make a difference regarding SAFER? We do not attempt to read those tea leaves as there are far too many variables, such as potential shifts in Congress, to predict. We think the fundamental SAFE ACT part of the bill is relatively uncontroversial. It is the add-ons that engender disagreement.
- SCHWAZZE DID THE RIGHT THING WITH ITS DEBT EXTENSIONS, BUT THE MARKET IS STILL CONCERNED.
-
- Schwazze extended the maturities of its $15M Altmore, LLC loan and its $17M Promissory Note owed to Reynold Greenleaf & Assoc. LLC, to November 2025. Both obligations were previously due in February 2025.
- SHWZ also obtained a $450,000 reduction in principal payments under the Altmore loan.
- Presumably, SHWZ surveyed the landscape for a more long-term financing solution but was not happy with what it saw. Frankly, we think this extension is close to ideal for the Company. It is low cost and covers the likely period in which S3 should be fully enacted, after which the Company may have better alternatives.
- The graph below shows that the market is still concerned. We note that based on our free cash flow adjusted current ratio, SHWZ continues to have liquidity hurdles to overcome. Meanwhile, Baker Tily has taken over as the company’s auditor, but uncertainty remains regarding potential restatements and the re-establishment of the company’s OTCQX listing.
-

- IS THE CANSORTIUM DEAL IN TROUBLE?
- The risk arb spread exploded to 105% last week from the mid-30 % range the week before (see the chart in the M&A section below). The spread is equal to the percentage profit an investor would make if they could purchase RIV stock, instantly exchange it into Cansortium at the announced deal exchange rate, and sell the Cansortium stock. We have been following the spread since the deal was announced, and the dramatic widening shows a significant change in investors’ rating of the likelihood of the deal closing.
- What could be wrong? Perhaps there is something about the plan for Scott’s Miracle Grow subsidiary Hawthorne to convert its RIV debt into exchangeable shares of Cansortium, that has hit a snag? That feature is fundamental to the deal economics, in our view, and it is absolutely critical to the credit improvement we see the deal creating.
- The announced merger with RIV Capital enhances Cansortium’s credit profile, and the Viridian Credit Tracker model ranking improves from #18 to #8.
- Cansortium’s net cash position goes from -$60.7M to $5.1M, dramatically improving its Viridian Capital Liquidity ranking from #23/30 to #9/30.
- Leverage is also significantly reduced, predominantly from the conversion of $175M of Hawthorne debt into Cansortium equity. The conversion also demonstrates support from Hawthorne’s parent, Scotts Miracle Grow.
- The combined company will jump to a #10 size ranking compared to the #21 ranking Cansortium had prior to the announcement.
- Cansortium is “all in” in Florida, and the transaction significantly improves the combined company’s ability to attack the potential conversion to rec of the State.
- We caution debt investors that the current risk arb spread says the deal is in danger, and cancellation of the deal would have significantly negative impacts on Cansortium’s credit rankings.
- WHAT’S SNDL’S DELTA 9 GAME PLAN NOW?
- As we expected, Delta 9 filed for Canadian bankruptcy protection, but with a significant twist.
- We had expected SNDL to provide DIP financing and eventually credit bid for the Company exiting CCAA.
- Instead, Delta 9 announced it had received a binding term sheet from the FIKA Company as a plan sponsor for the CCAA proceedings and acquirer of the D9’s cannabis retail store business and logistics and distribution business. The term sheet has FIKA providing up to $16M in interim financing, including up to $3M to fund the costs of the CCAA proceedings and up to $13M to repay the second lien-secured convertible debentures. FIKA is also proposing to provide up to $2M of its shares to existing D9 shareholders and to make available up to $4M in its shares for existing D9 unsecured creditors electing to convert into FIKA shares. FIKA is also proposing to repay the approximately $27.9M of additional 1st priority senior debt of D9 that SNDL recently purchased.
- FIKA is a leading Canadian cannabis retailer, operating 144 stores across Canada. Little is currently known about FIKA’s financial strength and its ability to perform its obligations under the submitted term sheet. The court will clearly want to see this information when evaluating options in the D9 CCAA case.
- Does this mean SNDL is OUT? We are not sure how surprised they were to see D9 produce a sponsor entering CCAA, but we doubt we have seen the last of SNDL in this ongoing story.
- Background:
- On May 24, 2024, Delta 9 Cannabis announced that it had received a demand letter from SNDL for the repayment of its 10% Senior Secured second lien convertible debentures for a total of about $10M. Delta 9 replied that it was not in payment default on the notes, leaving open the question of whether it violated the covenants. Delta 9 promptly formed a committee of its Board to review “strategic alternatives.”
- On July 5, 2024, SNDL stepped up the pressure with an announcement that it had acquired $20.7M of Delta 9’s First Priority secured debt from Connect First and Servus Credit, gaining a first priority secured interest in substantially all of Delta 9’s assets. SNDL’s playbook is pretty straightforward. Look for them to play tough enough as creditors that Delta 9 falls into bankruptcy, and then SNDL will credit bid its debt for ownership of the assets. Delta 9 is in pretty tough financial shape. It ranks #27/31 in the Viridian Capital Credit model for Canadian Cultivation and Retail companies with less than $50M market cap. Its total liabilities to market cap ratio of 40x basically says it all.
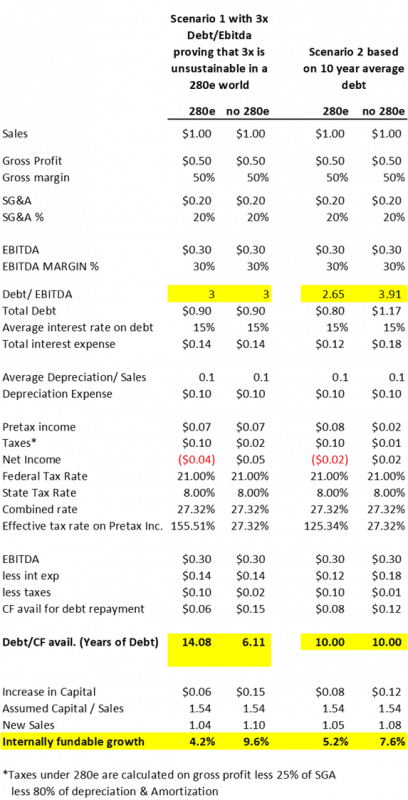
- LESS RECOGNIZED BENEFITS OF RESCHEDULING: HIGHER SUSTAINABLE DEBT LOADS AND INTERNALLY FUNDABLE GROWTH
- Key takeaways from the chart below
- The analysis assumes a hypothetical company with $1 of sales, 50% gross margins, and 30% EBITDA margins.
- The analysis shows that the hypothetical Company experiences greater than 100% effective tax rates despite the allocation of 80% of depreciation expense and 25% of SG&A expense to COGS. The same Company would have a combined state and federal effective tax rate of 27.32% without 280e
- Debt levels of 3x EBITDA are not sustainable in a 280e world, but not because interest coverage is inadequate. Using 15% average debt, we get 2.14x EBITDA/Interest coverage. The issue is the debt payback period. We calculate a debt payback of over 14 years with the given assumptions, which no regular cannabis lenders (except sales leaseback providers) will accept. S3 reduces the payback period to a more acceptable 6.11 years.
- If we assume ten-year payback periods, the removal of 280e would increase sustainable debt loads from 2.65x Debt/EBITDA to 3.91x.
- The bottom set of numbers shows the impact 280e has on internally fundable growth. In this analysis, we utilize the capital/sales ratio of 1.54x, which we discussed in the Virdian Chart of the Week. With 280e and 3x debt, companies can only internally fund 4.2% sales growth. The elimination of 280e more than doubles internally fundable growth to 9.6%.
- Key takeaways from the chart below
- The DOJ has signed off on S3, and the 60-day public comment period has commenced. Why does the equity market not care?
- It now seems overwhelmingly likely to happen, and the critical question is whether it will really happen as quickly as advertised.
- Institutional investors who have avoided the space would rather miss part of the rally than jump in for another ride like the last two years. Talking to investors, rating agencies, and other constituents, we find deep distrust for administrative actions like rescheduling. It is ironic that the very lack of congressional involvement that makes S3 likely to happen also imbues it with an aura of impermanence. Like the Cole memo, the fear is that a new administration may delay implementation or even reverse course.
- Many details still need to be worked out, and investors still question how the State programs, the FDA, and Big Pharma will interact in an S3 world. Widely differing opinions exist on when S3 will actually become effective.
- S3 could potentially have some perverse results. The extra funds might be competed away in misplaced attempts to gain market share. Also, the additional cash could foster capacity additions that hasten oversupply and commodity price declines.
- We generally give little credence to claims that the DEA and FDA will become more rigorous in enforcing federal laws requiring S3 products to be approved by the FDA. Our position is based on two words: politics and money. Rescheduling is only coming to fruition because Biden is desperate for youth votes, and his DOJ is unlikely to support a new crackdown on state-licensed cannabis programs that it didn’t do while cannabis was S1. It is unlikely to undertake actions detrimental to tax-paying state-based businesses.
- Still, despite the uncertain timing, regulatory implementation, etc., our view is that the various regulatory, judicial, and legislative tracks for cannabis industry reforms are mutually reinforcing. We have never seen so many potential upside catalysts in any other industry. We still view a doubling in price levels as reasonably achievable.

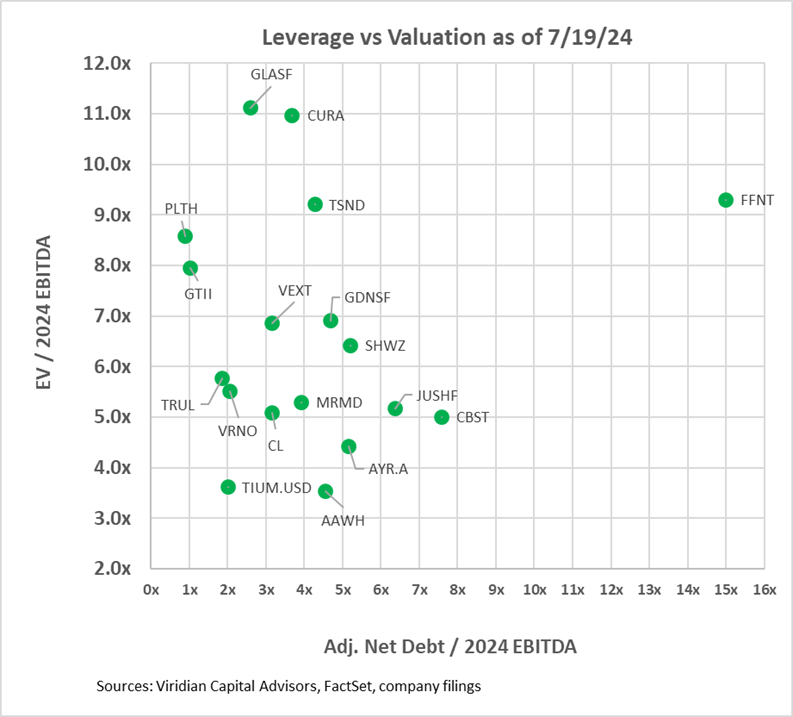
- VALUATION, LEVERAGE, AND LIQUIDITY
- The two graphs below show the Enterprise value to 2024 EBITDA multiples against two leverage measures. In the first graph, we have calculated an Adjusted Net Debt/ 2024 EBITDA figure by adding any accrued taxes over 90 days of tax expense to debt before subtracting cash to arrive at Adjusted Net Debt. We would expect any regular company to have accrued taxes equal to their last quarterly tax expense and consider that a standard working capital item. Several companies on the chart have far greater than 90 days of accrued taxes, and we consider the excess to be debt. Verano’s excess tax liabilities equal nearly 40% of its debt. Other companies with relatively high imputed tax debt include Curaleaf (CURA: CSE), 4Front (FFNT: CSE), and Terrascend (TSND: TSX). We have adjusted our accrued tax liabilities for comparability by adding back the tax liabilities that Trulieve, TerrAscend, and AYR moved into long-term liability accounts.
- The first graph shows that twelve of the eighteen companies have net debt/ 2024 EBITDA over 3x, which we view as the cutoff of sustainability in a 280e world. We view 4x as sustainable in a post-280e environment, and nine companies are now over that threshold.
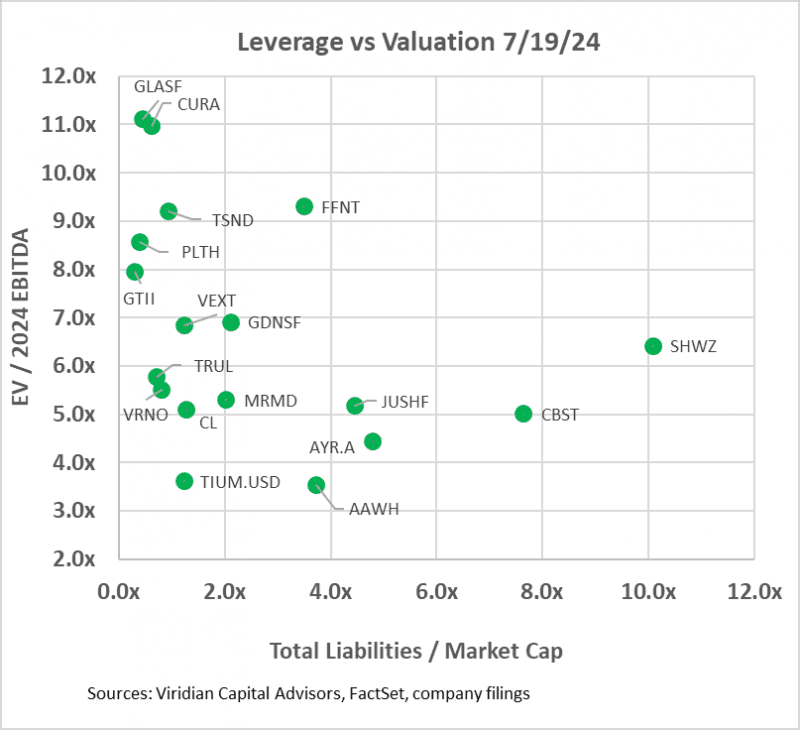
- The second graph looks at leverage through the lens of total liabilities to market cap. This measure separates the companies into four groups:
- On the bottom left are companies with low valuation multiples but also low market leverage. The group includes Verano, Trulieve, Cresco, and MariMed. The other three show that the market is not yet willing to fully sign on to the Florida rec story.
- In the middle, between 2x and 4x total liabilities/market cap, we see 4Front, Ascend, AYR, Goodness Growth, and Jushi. Each of these has more than 4x debt/ EBITDA, which is borderline in terms of sustainability, even in a non-280e world. However, each also has significant upside catalysts that could mitigate or exacerbate the excess leverage. FFNT is ramping up production at its mammoth Illinois cultivation facility. Ascend has a $275M term loan maturing in August 2025 that will need to be extended or refinanced. This loan is 110% of the Company’s market cap, which is higher than the percentage of debt maturities that AYR restructured at the end of 2023. Jushi is levered to potential adult rec developments in Pennsylvania and Virginia.
- On the right lie Cannabist and Shwazze. The high level of market leverage tells us that the market questions whether they can discharge their liabilities without significantly dilutive actions, and doubts are also shown by their 22/31 and 20/31 positioning in our weekly credit ranking. Cannabist has seen the writing on the wall: to levered to issue equity or debt, its only option was asset sales, and its exit from Florida was a recognition of this.
- At the top left are companies with high valuation metrics and low leverage. These companies should look to do an equity issuance depending on their positioning in the liquidity graph below.
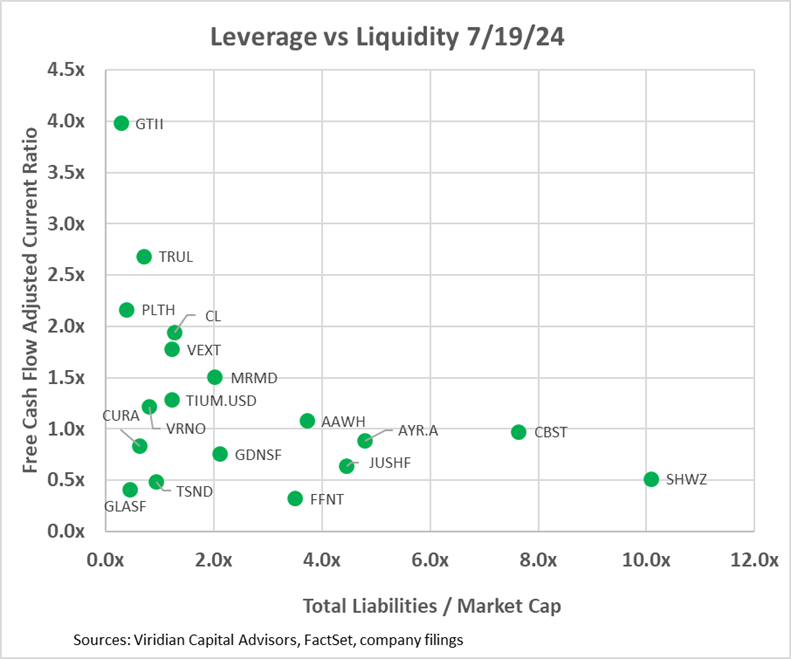
- The third graph introduces the free cash flow adjusted current ratio liquidity measure into the mix. Companies with less than 1x on this measure will likely have to raise capital next year. Surprisingly, eight of the companies fall into this bucket. This graph also breaks the sector into three distinct groupings. The bottom left group has low leverage but also modest liquidity. Some of the companies, including Verano, MariMed, and Cresco, have sufficient but not comfortable levels of liquidity, while others, including Curaleaf, TerrAscend, and Glass House, are below the critical 1x liquidity line. Companies on the lower right generally have constrained liquidity and high leverage, a potentially dangerous combination in a capital-constrained environment.
- Schwazze has alleviated some, but not all, of its near-term liquidity problem by extending the maturities of $32M to its debt. Its free cash flow adjusted current ratio remains under 1x, indicating additional financing may be required. The market is still skittish about the Company, as is evidenced by its 12.12x status on total liabilities to market cap.
- Ascend’s new financing significantly improves the Company’s liquidity. However, its free cash flow adjusted current ratio remains unchanged since the original debt maturity was not yet included in current liabilities.
-
-
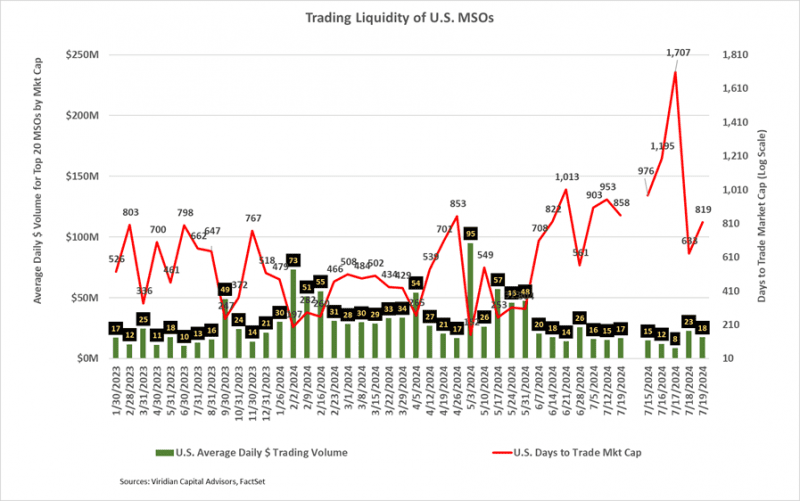
- CANNABIS STOCK LIQUIDITY REBOUNDS OFF LOWS
- The average daily dollar volume of $15M was the fourth lowest of the year. Liquidity in terms of Days to Trade Market Cap (see below) was worse than the corresponding period in 2023 despite several uplistings in the interim.
- The Days to Trade Market Cap (DTTMC) series depicts the number of days it would take to trade the market cap of a stock or group of stocks. Despite the positive progress since last week, the weekly reading of 858 days on 7/19/24 was the fourth worst reading of the year. An 858 DTTMC implies that an investor who acquired a 5% position in the stock, assuming he wanted to be less than 25% of the average daily dollar volume, would require 172 days to trade out of his position. The age-old chicken and egg question: are there no institutional investors because market liquidity is so low, or is market liquidity so low because there are no institutional investors?
- We are firmly in the grip of the summer doldrums, but exciting macro events seem likely for the month ahead. Will trading volumes accelerate accordingly?
- CANNABIS STOCK LIQUIDITY REBOUNDS OFF LOWS
-
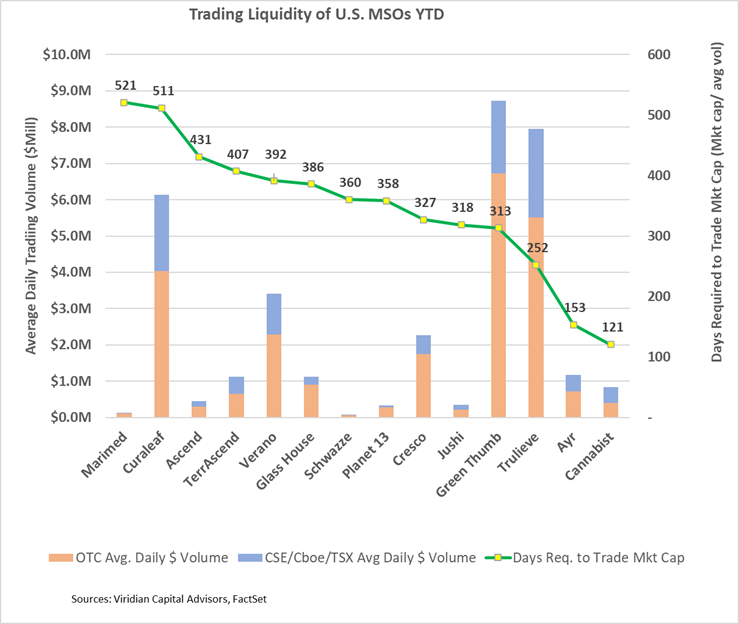
- The graphs below show the individual company liquidity picture. Interestingly, Curaleaf (CURE: TSX) and TerrAscend (TSND: TSX), two companies that uplisted to the TSX, continue to have among the lowest liquidity based on our DTTMC measure. The graph shows that $ trading volume is a poor indicator of actual liquidity.
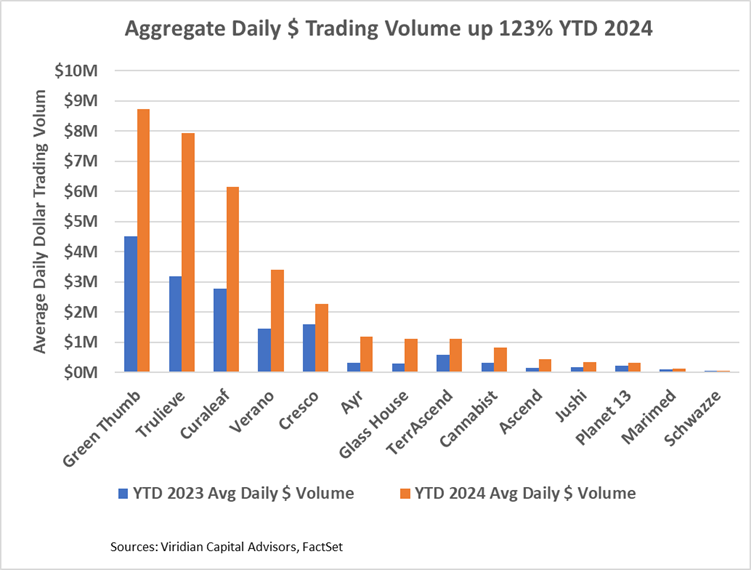
- The bottom graph shows that liquidity remains poor despite an average 123$ increase in dollar volume YTD in 2024 compared to the same period in 2023.
-
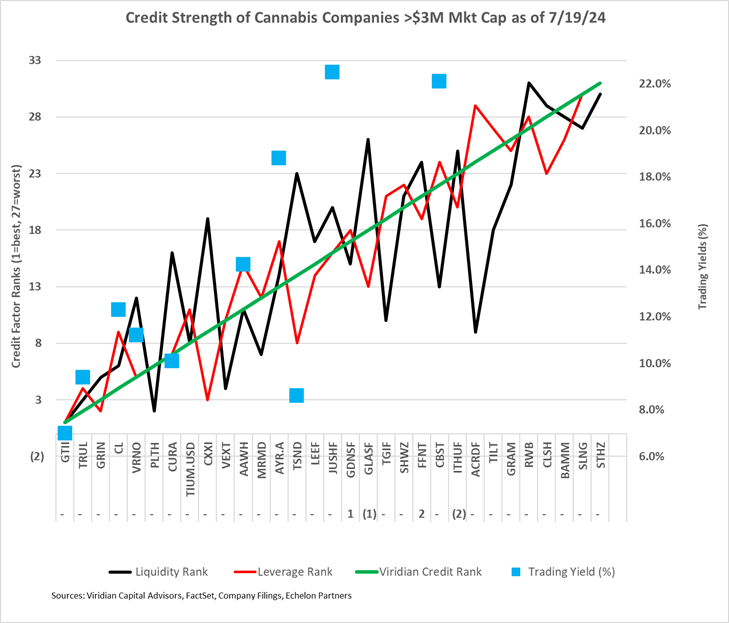
- GIVING CREDIT WHERE CREDIT IS DUE
- The chart below shows our updated 7/19/24 credit rankings for the 31 U.S. cannabis companies with over $3M market cap. The number below the ticker symbol indicates the change in credit ranking since last week, where a negative number suggests credit deterioration, while a positive indicates improvement.
- The blue squares show the offered-side trading yields for each Company. Trading yields have declined significantly since the HHS rescheduling announcement.
- There were few significant changes in rankings this week. 4Front (FFNT: CSE) improved by two notches primarily due to improved market leverage readings.
- Although Ascend’s announced new financing materially improves the Company’s medium-term liquidity, it did not change its Viridian credit rankings because the previous debt maturity was still outside the range of inclusion in current liabilities. See our comments about the deal above.
- GIVING CREDIT WHERE CREDIT IS DUE

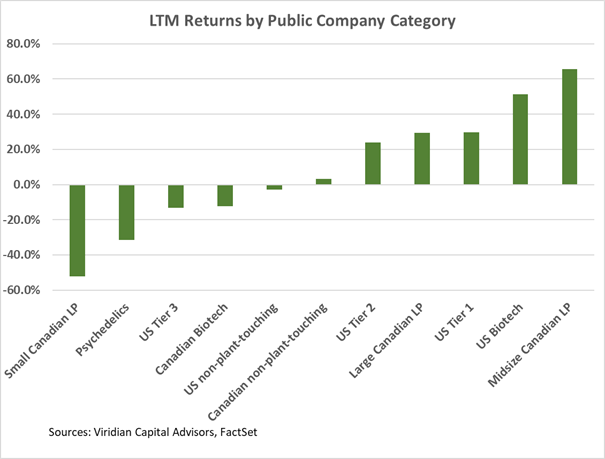
Trailing 52-Week Returns by Public Company Category:
-
- Tier one U.S. MSOs gained one ranking slot to number three in LTM performance with a gain of about 30%. Significantly negative returns by TerrAscend (TSND: TSX) and Cannabist (CBST: Cboe) offset stellar performances by Green Thumb (GTII: CSE), Trulieve (TRU: CSE), and AYR (AYR.A: CSE).
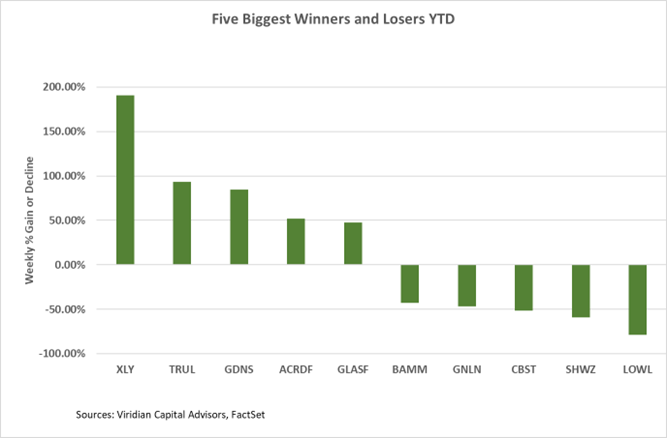
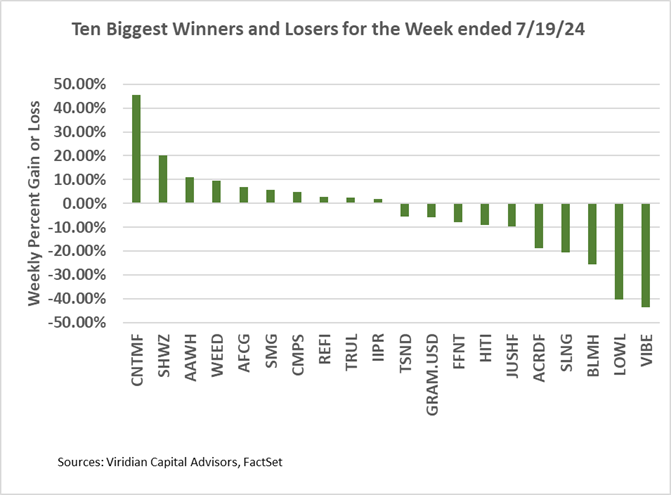
Best and Worst Performers for the week ended 7/15/24:
- The largest gainer of the week was Cansortium (CNTMF: OTCQB). The company’s 45.6% gain significantly widened the arb spread with its intended merger target RIV, suggesting potential issues with the deal. Attempts to reach the the company were not returned by press time.
- Vibe Growth (VIBE: CSE) was the biggest loser, down 43.6%. We saw no news to account for the decline.