Chart of the Week

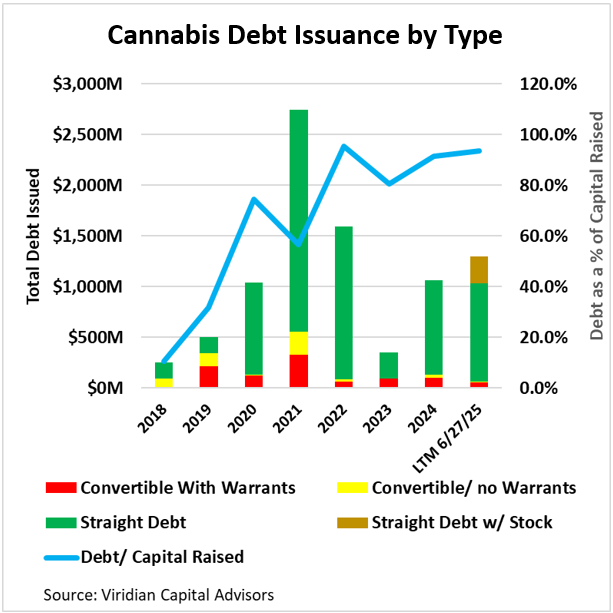
The Viridian Capital Chart of the Week highlights key investment, valuation and M&A trends taken from that week’s Deal Tracker that we believe are impactful for investors, companies and acquirers.
Viridian Capital Chart of the Week: Cannabis Stock Trading Volume Explodes on MAGA Influencer Comments

- The MSOS ETF price rose 32% over the last two weeks. The only other period in the ETF’s history that matched that performance was during the three weeks following the August 25, 2023, HHS announcement that it was endorsing a rescheduling to S3. We wish we could point to an announcement that was equally monumental for the current rally; however, it appears that the proximate cause was a series of seemingly connected tweets by MAGA influencers, including Mat Goetz, Ricky Williams, and Mike Tyson.
- Often, sharp moves in cannabis stocks occur with little trading volume, but that was not the case this time. Trading volumes jumped upward on an apparent sea change in sentiment.
- The chart shows average daily trading volume for eighteen cannabis stocks. The green bars represent the average daily volume of shares traded in the last twelve months ended July 11, 2025. The orange bars depict the average daily volume for the week ended July 11, 2025. The chart is arranged in order of percentage volume gains.
- The average daily volume for the entire group increased by 26.6%. Only four companies, Vext (VEXT: CSE), Canabist (CBST: Cboe), Vireo (VREO: CSE), and MariMed (MRMD: CSE), had lower trading volumes. The other 14 had an average of 40% higher volume last week than in the LTM period.
- Rapid changes in market sentiment have always driven cannabis, but we have never seen such drastic changes based on so little.
- We hope the MAGA influencers truly have Trump’s ear and can persuade him to move forward with his campaign promises. Still, we find it scary that comments by Mike Tyson can move the entire cannabis market. Call us old-fashioned.
