Viridian Data Analytics
The Market Intelligence on Cannabis/Hemp/Psychedelic Capital Raise and M&A Transactions used by companies, investors, acquirers and advisors to make informed capital allocation and M&A Decisions.
Transaction Activity for Week:
- No capital raises closed during the week ended December 26th, 2025. This week last year held three raises for a total of $25.3M.
- Two M&A deals closed with a total disclosed transaction value of $47.0M during the week ended December 26th, 2025.
CANNABIS DEALS
(LTM Ended 11/7/2025)
2024
2025
Equity Capital Raised
EQUITY TRANSACTIONS
$0.98B
60
$0.44B
84
DEBT CAPITAL RAISED
DEBT TRANSACTIONS
$1.34B
58
$1.67B
56
M&A TRANSACTION VALUE
M&A TRANSACTIONS
$1.17B
78
$2.10B
49
Viridian Insights of the week
-
- CANNABIST GETS A BETTER DEAL FOR VIRGINIA
- TRUMP SIGNS EXECUTIVE ORDER, REBOOTING THE RESCHEDULING PROCESS AND MORE
- CANNABIST GETS A BETTER DEAL FOR VIRGINIA
- SUPREME COURT DECLINES TO HEAR CANNA PROVISIONS CASE
- ANALYSTS ARE QUITE UPBEAT ABOUT 2026
- THE 2026 DEBT MATURITY WAVE IS LOOKING LESS THREATENING
- HOW MUCH OF THOSE 280E SAVINGS WILL FIRMS ACTUALLY BE ABLE TO KEEP?
- MEASURES OF MSO VALUATION, LEVERAGE, AND LIQUIDITY
Viridian Cannabis Deal tracker for the week ended 11/21/25
Viridian Sector Deal Tracker
Analyzes transactions by industry sector in order to track the flow of capital and M&A across 12 industry sectors – from cultivation to brands to software.
Viridian Regional Deal Tracker
Analyzes deals by location of issuer/seller in order to track the flow of capital and M&A deals by state and country.
European Deal Tracker
The European Deal Tracker is a monthly report that includes all equity, debt, and M&A transactions that occurred in the region.
DETAILED DESCRIPTION OF DATA SERVICES

Equity Deals
Provides weekly data and insight into Cannabis /Hemp/Psychedelic industries’ equity issuances

Debt Deals
Provides weekly data and insight into Cannabis/Hemp/Psychedelic industries debt issuances

M&A Deals
Provides weekly data and insight into Cannabis/Hemp/Psychedelic industries M&A deals.

Valuation Tracker
Provides valuation analysis for over 370 public Cannabis/Hemp/Psychedelic companies.

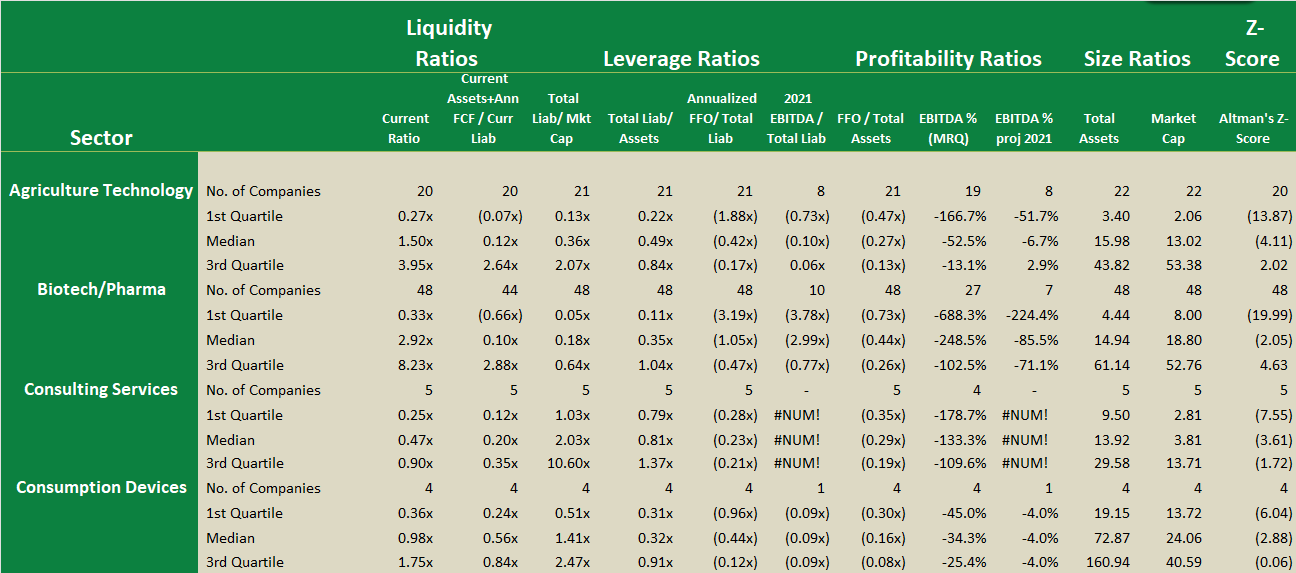
Credit Tracker
Provides credit/liquidity analysis and rankings for over 370 public cannabis/Hemp companies.

Industry Sector Tracker
Analyzes transactions by industry sector in order to track the flow of capital and M&A across 12 industry sectors – from cultivation to brands to software.

Regional Tracker
Analyzes deals by location of issuer/seller in order to track the flow of capital and M&A deals by state and country.

Chart of the Week
Provides insight on the most influential trends from the past week in the Cannabis /Hemp/ Psychedelic industries.
LATin america deal tracker
The Latin America Deal Tracker is a monthly report that includes all equity, debt, and M&A transactions that occurred in the region.
European
Deal Tracker
The European America Deal Tracker is a monthly report that includes all equity, debt, and M&A transactions that occurred in the region.

YTD Charts for Capital Raises
Consists of an overview of capital raise activity in the Cannabis/Hemp/Psychedelic industries from the current year.

YTD Charts
for M&A
Consists of an overview of the M&A activity in the Cannabis/Hemp/Psychedelic industries from the current year.
Viridian Capital Advisors Offers unique propriety data services including:
- Equity Deals
- Debt Deals
- M&A Deals
- Valuation Tracker
- Credit Tracker
- Sector Tracker
- Regional Tracker
- Special Reports
- Chart of the Week
- YTD Charts for Capital Raises
- YTD Charts for M&A
Examples of our data, analytics, and market intelligence
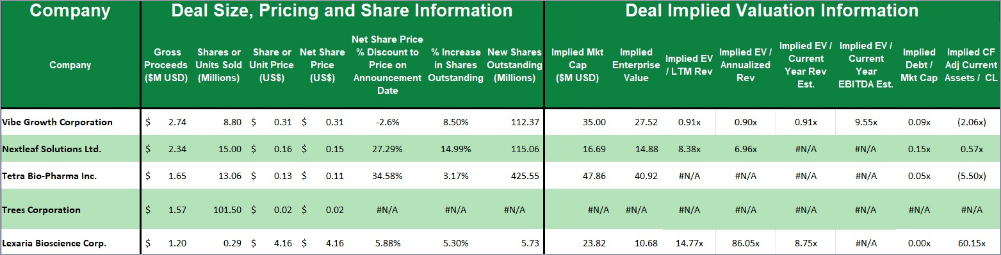
Equity Deal Tracker
The Equity Deal Tracker includes a weekly analysis of equity issuance. Data includes issuer specific information, deal size, pricing, share information, deal implied valuation information, and warrant information.
M&A Deal Tracker
The M&A Deal Tracker includes a weekly analysis of mergers & acquisitions in the cannabis industry. Weekly data on deals includes the acquiror and target information, deal size, type of deal, structure, and valuation information.
Credit Tracker
When it comes to credit ratings for Cannabis/HEMP/Psychedelic companies, many investors, acquirers, and lenders have been left in the dark with a lack of information. With Viridian’s data and market intelligence, that is no longer the case. The Viridian Cannabis Credit Tracker is the first of its kind, providing users with a proprietary credit ranking system for companies based on a company’s liquidity, leverage, profitability, and size.