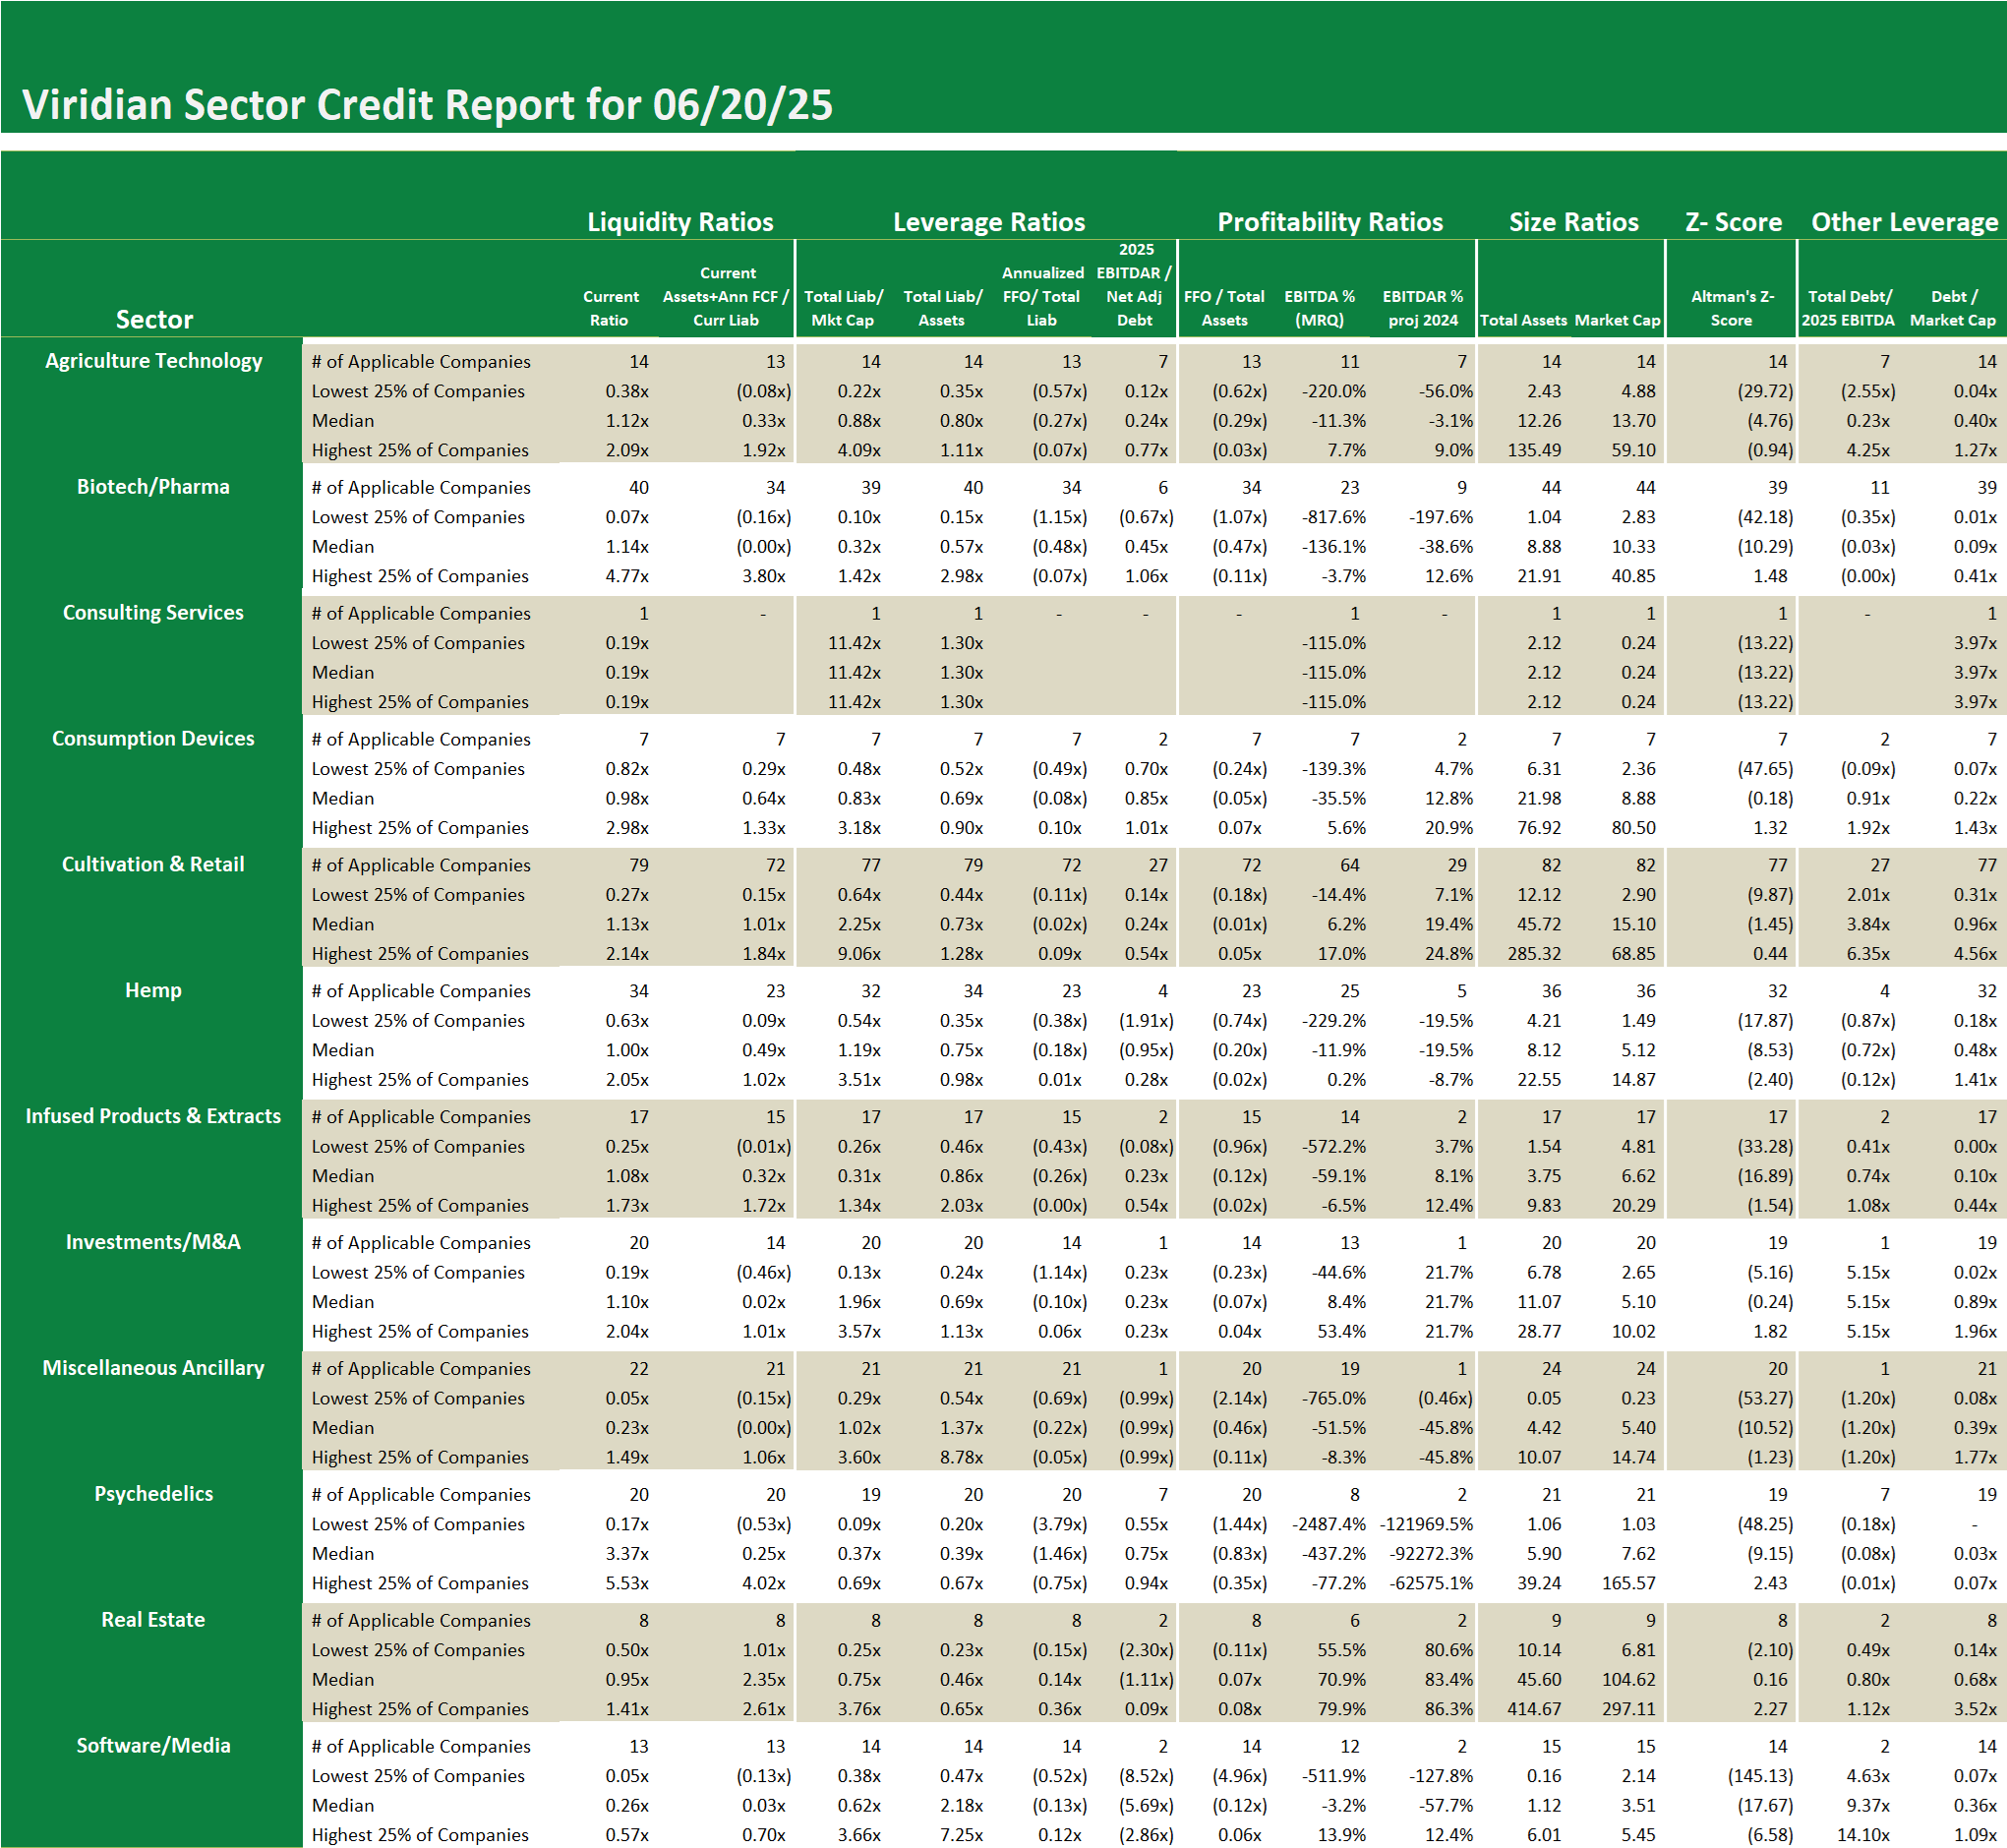
Credit ratings are not currently available for public cannabis companies leaving companies, lenders and investors with a gap of information. The Viridian Cannabis Credit Tracker fills this gap. The model uses 11 market and financial statement variables to discern 4 key credit factors: Liquidity, Leverage, Profitability, and Size, to provide credit/liquidity analysis for over 370 public Cannabis/Hemp companies.
Weekly Credit Report – Ranking Canadian and U.S. Cultivation & Retail sector companies with market caps between $20M and $200M
-
- We screened cultivation and retail companies from the U.S. and Canada with market capitalizations between $20M and $200M to identify lesser-known companies of solid credit quality.
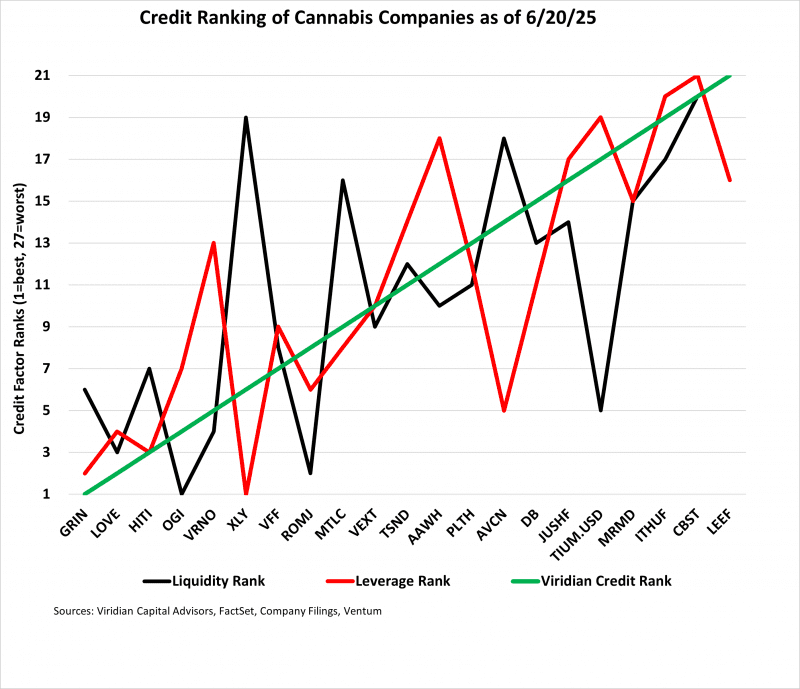
- The chart below shows the rankings of the 21 companies. The green line represents the Viridian Credit model rank of the company, the red line depicts the leverage ranking, and the black line shows the leverage ranking. More detailed credit metrics can be found in our detailed weekly credit report table.
-
- The top small to midsized credits are Grown Rogue (GRIN: CSE), Cannara Biotech (LOVE: CSE), High Tide (HITI: CSE), and Organigram (OGI: CSE). Each of these has strong liquidity, as measured by free cash flow-adjusted current ratios of over 1.75x, Low leverage, as indicated by liabilities-to-market-cap ratios under 0.6x, and solid cash flow, as measured by funds from operations to liabilities of over 0.2x.
- Conversely, the weaker credits in our ranking, including MariMed (MRMD: CSE), IAnthus (ITHUF: OTC), Cannabist (CBST: Cboe), and Leef Brands (LEEF: CSE), all exhibit weak liquidity and significantly higher leverage measures. Leef is a bit of a special case. The company is establishing a massive outdoor grow facility and expanding its brand presence to New York. The results of these two moves could make a dramatic difference in the credit profile going forward.
- Verano, ranked as #5/21, benefits from having the top size score in the group. We believe that size matters. Larger companies generally have more established business relationships, more ancillary assets that can be sold if necessary, and greater diversification. Offsetting this benefit is the company’s high liabilities-to-market cap ratio, ranking #16/21. This may be related to the significant contingent liability posed by the VIREO lawsuit, although the company’s cash flow and balance sheet leverage indicators are also high.
- The Altman Z scores are generally consistent with our rankings and confirm the credit strength of our top-ranked companies.
Credit ratings are not currently available for public cannabis companies leaving companies, lenders and investors with a gap of information. The Viridian Cannabis Credit Tracker fills this gap. The model uses 11 market and financial statement variables to discern 4 key credit factors: Liquidity, Leverage, Profitability, and Size, to provide credit/liquidity analysis for over 370 public Cannabis/Hemp companies.
Weekly Sector Credit –Infused Products and Extracts
-
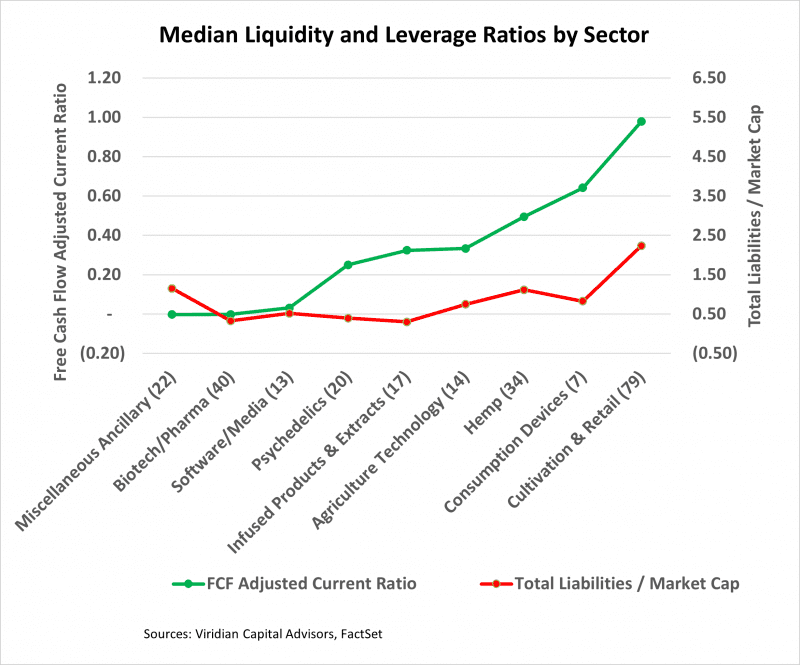
- The 17 companies in the Infused Products and Extracts sector demonstrate relatively weak credit stats. The companies are generally quite small, with a median total assets of only $3.75 million and a market capitalization of $ 6.62 million.
- Liquidity is quite weak, with a free cash flow-adjusted current ratio median of only 0.32x, indicating that over half of the companies have pressing needs for additional funding.
- Leverage is not excessive, with a median debt-to-2025 EBITDA ratio of only 0.74x; however, cash flow is generally negative, with a median funds from operations to total liabilities ratio of -0.26x.
- The general picture can be summarized as small companies with limited access to debt or credit markets, resulting in poor liquidity and cash flow.
- The good news here is that the median total liabilities to market capitalization ratio of 1.19x indicates a market belief that these companies have solid asset value coverage of their liabilities.
- See the Viridian Credit Sector Report for more details.
Weekly Sector Credit –Infused Products and Extracts
-
- The 17 companies in the Infused Products and Extracts sector demonstrate relatively weak credit stats. The companies are generally quite small, with a median total assets of only $3.75 million and a market capitalization of $ 6.62 million.
- Liquidity is quite weak, with a free cash flow-adjusted current ratio median of only 0.32x, indicating that over half of the companies have pressing needs for additional funding.
- Leverage is not excessive, with a median debt-to-2025 EBITDA ratio of only 0.74x; however, cash flow is generally negative, with a median funds from operations to total liabilities ratio of -0.26x.
- The general picture can be summarized as small companies with limited access to debt or credit markets, resulting in poor liquidity and cash flow.
- The good news here is that the median total liabilities to market capitalization ratio of 1.19x indicates a market belief that these companies have solid asset value coverage of their liabilities.
- See the Viridian Credit Sector Report for more details.