Viridian highlights a specific industry sector and provides a deep dive into valuation metrics and comparable company valuations for public companies operating in that sector. The Weekly Valuation Tracker provides proprietary, actionable valuation data.
Weekly Valuation Report – Two Ways to Look at MSO Valuation
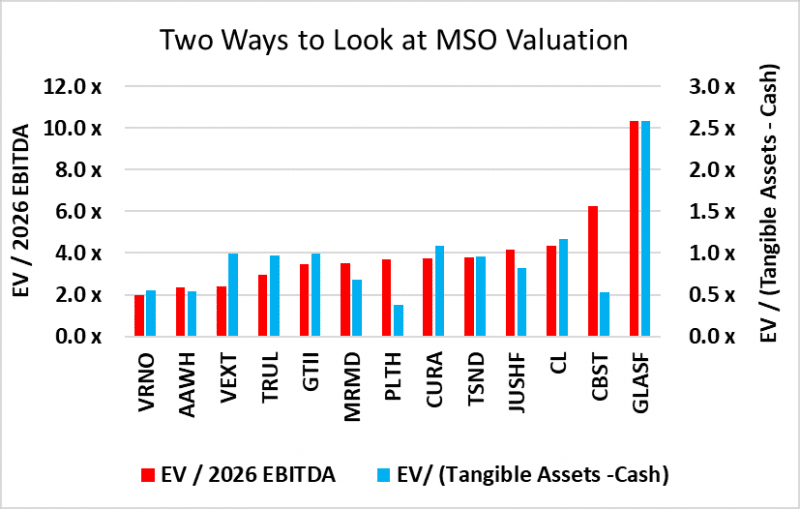
- The chart below shows two ways to view MSO valuations. The red bars show traditional Enterprise Value / 2026 EBITDA, while the blue bars depict a less frequently used ratio: Enterprise Value / ( Tangible Assets – Cash). The logic of the latter ratio is that enterprise value is based on market equity + debt-cash, which is analogous to tangible assets minus cash, especially if we assume that the value of MSO intangibles is suspect.
- Note first the close correlation between the two valuation methods.
- The low EV/2026 multiples of Verano and Ascend become even more curious when we see that they are both trading around half of their net tangible assets. With Verano, this might be explainable by the contingent liabilities of the Vireo suit. We see no such easy answer for the deep discount valuation of Ascend.
- The top market cap companies, including GTI, Trulieve, Curaleaf, and Cresco, trade at significantly different EBITDA multiples, but they all trade between 1.0x and 1.16x net Tangible Assets.
- We have remarked about the tremendous premium that Glass House trades at on an EV/2026 EBITDA basis, and it is just as much an outlier on the basis of EV/Net Tangible Assets.
- Investors should examine this new valuation ratio more closely. Companies like Verano, Ascend, MariMed, Planet 13, and Cannabist, which are trading at significantly lower than 1x, should be reviewed as potential bargains. Some of these, such as Verano and Cannabist, have plausible explanations, while others warrant further investigation.
The Viridian Value Tracker is the most comprehensive valuation product in the industry.
-
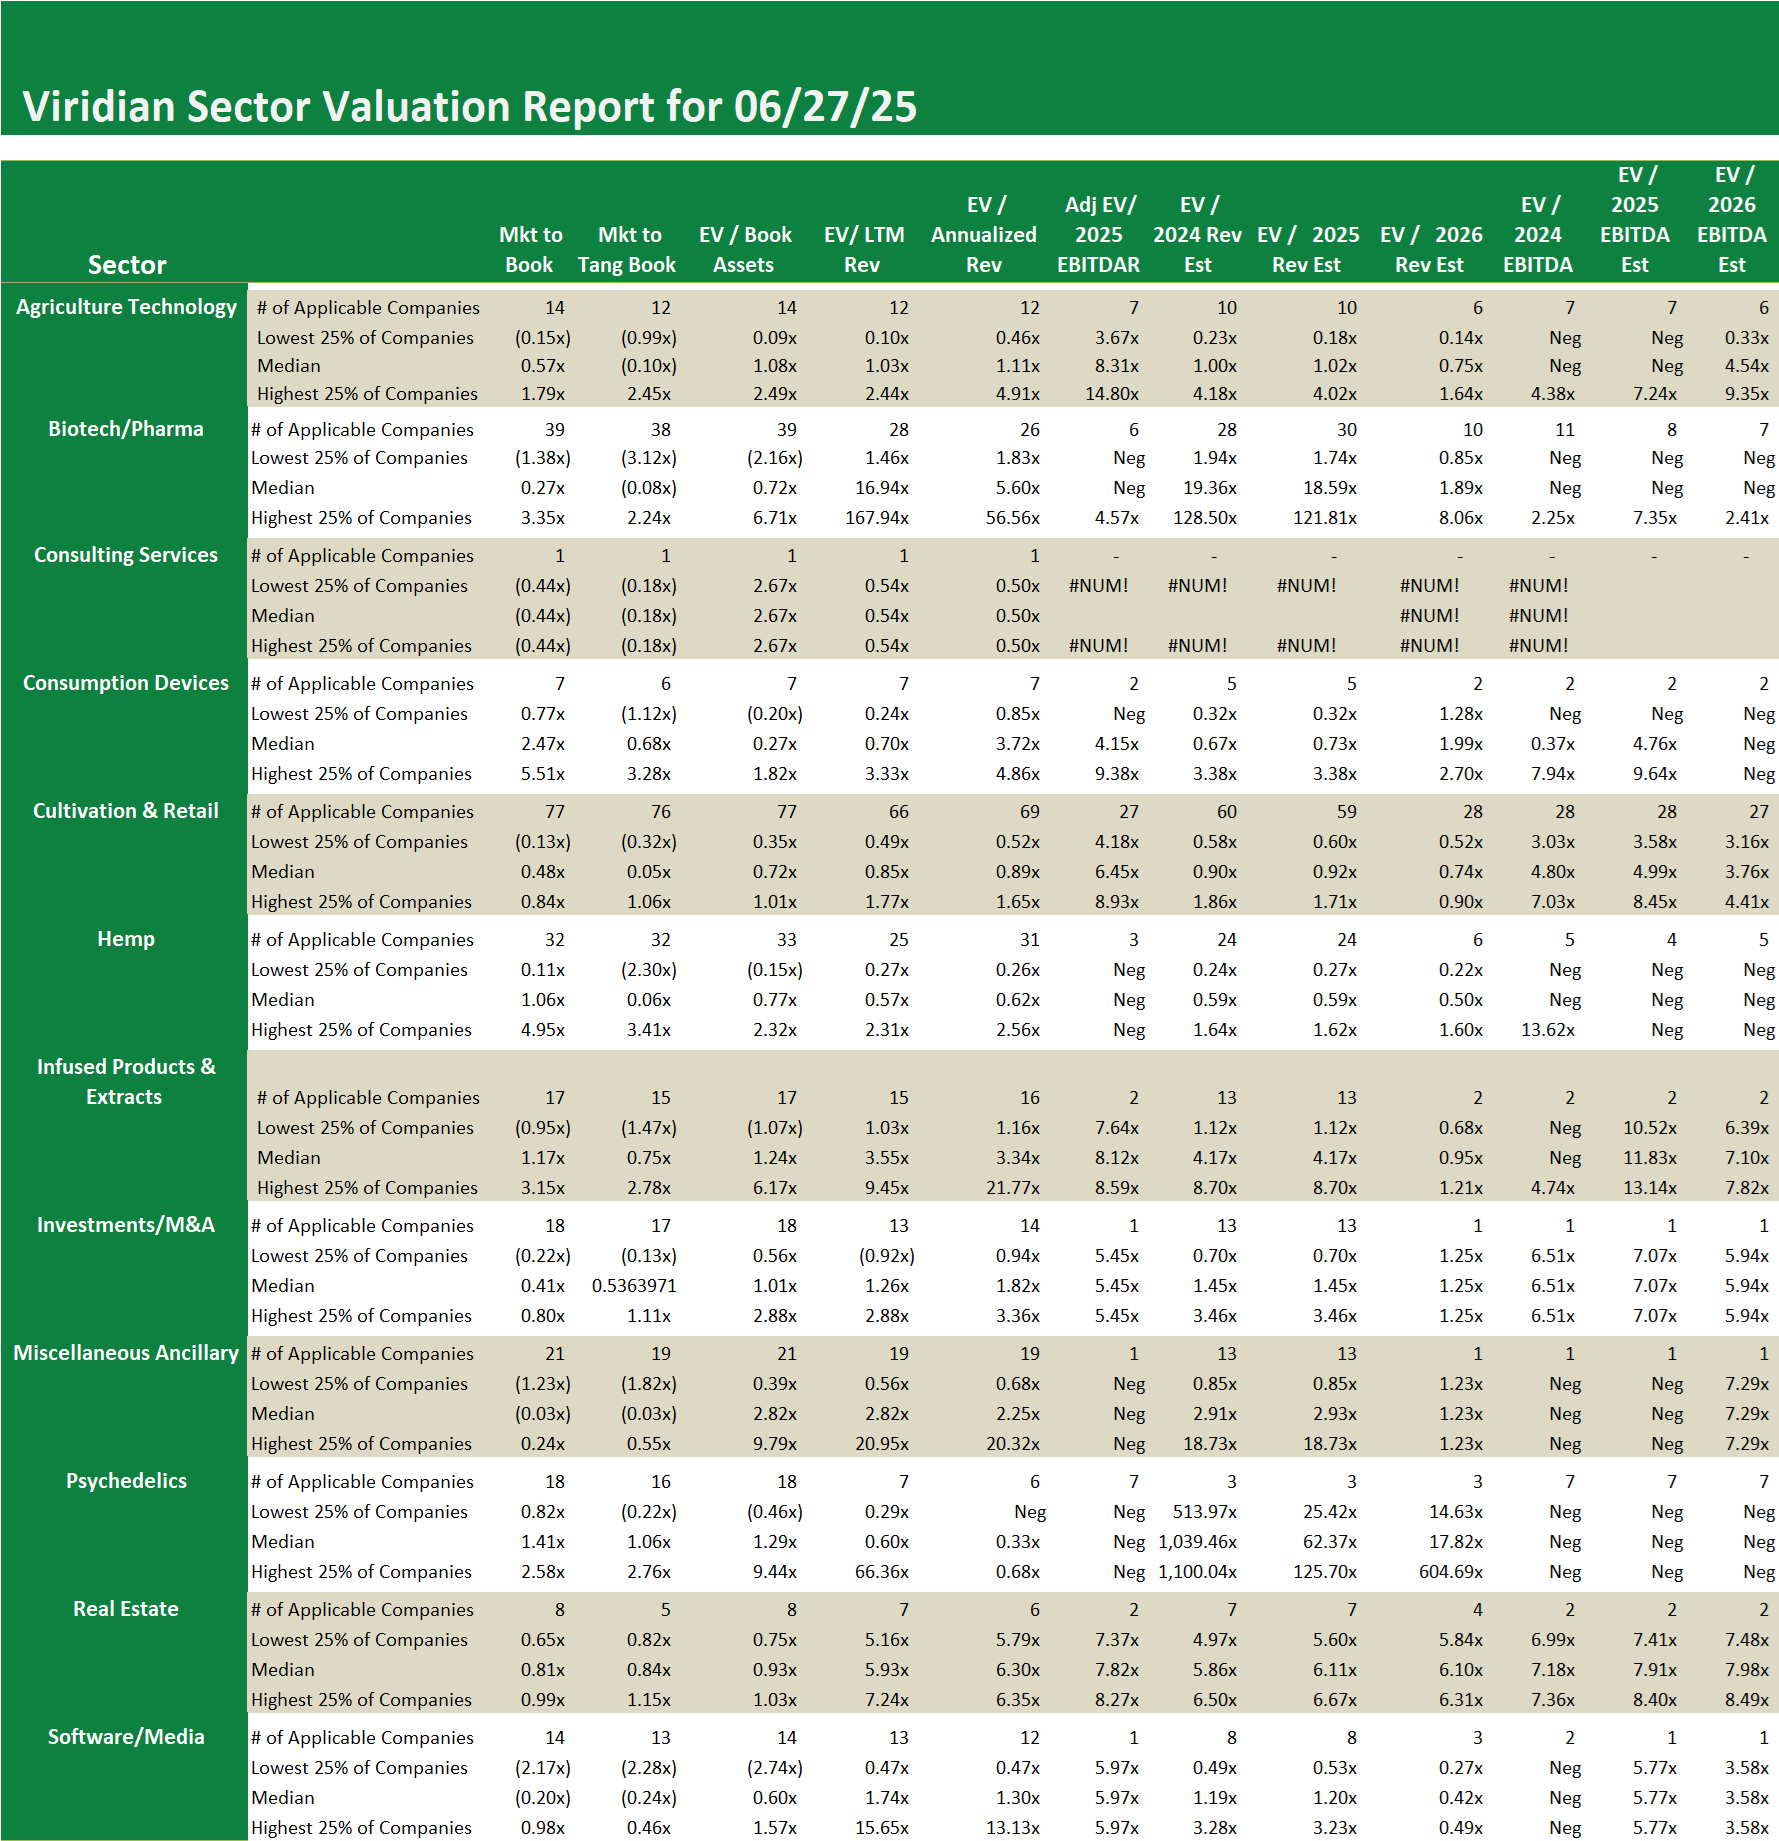
- A broad set of 12 valuation measures assures applicability, regardless of whether the company has analyst coverage or revenues. The typically presented EV/ Projected Revenues and EV/ Projected EBITDA are available for less than 1/3 of the cannabis companies we track.
- Most valuation studies present only the average valuation measures, while the Tracker goes one step further and shows the distribution of values (the quartiles, median, and dispersion) for each measure. This gives users a more complete view of how companies in the cohort group are valued.