OUR 9TH YEAR OF PROVIDING PROPRIETARY CAPITAL MARKETS INTELLIGENCE ON THE CANNABIS / HEMP / PSYCHEDELIC SECTORS
Each week, Viridian publishes insights and analysis on completed capital raise transactions in the prior week, focusing on all equity and debt deals. Our analysis includes:
- Summary
- Outlook
- Best & Worst Perfromers
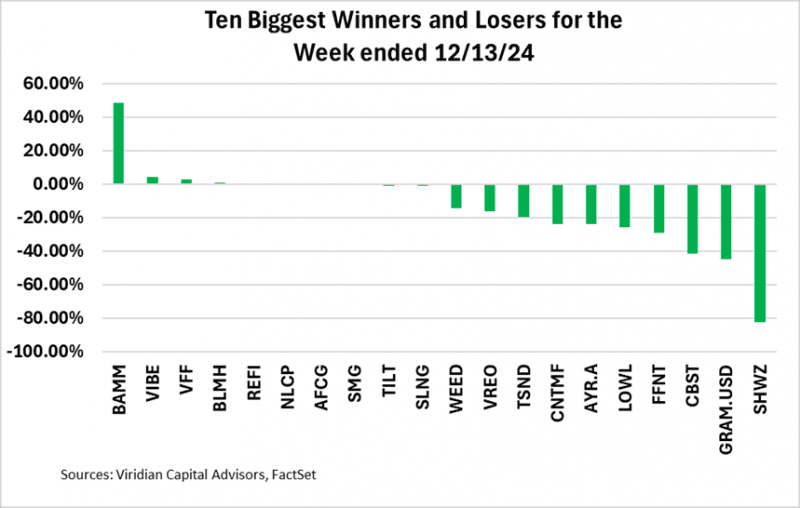
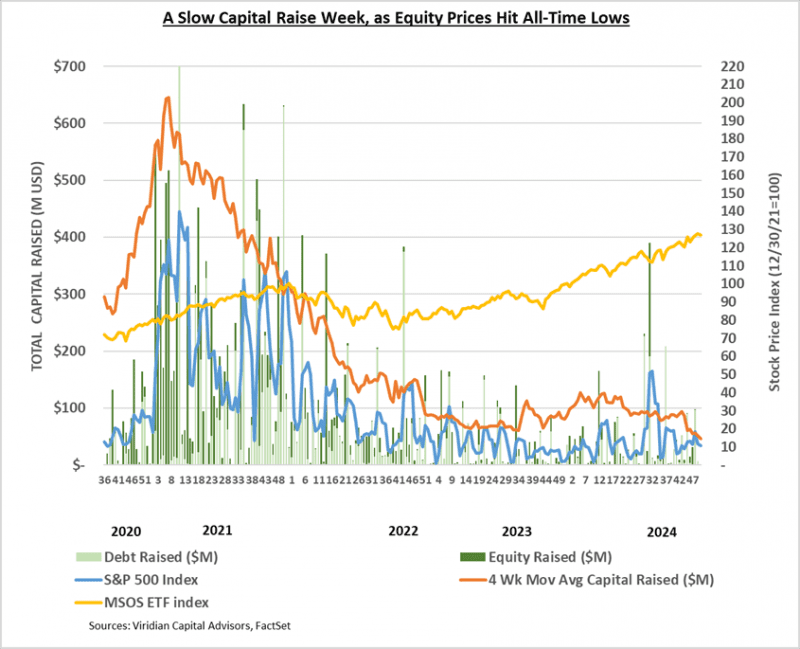
- Two capital raises closed in the week ended 12/13/24 for total proceeds of $1.64M, one less raise than last week but with a $5.51M lower volume. This week in 2023 also held one more raise than this year with a $4.36M higher total value. The average deal size was $0.8M this week compared to $2.0M in the year-ago period.
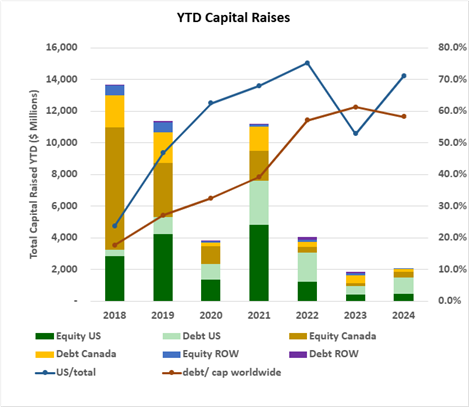
- YTD capital raises totaled $2,211.55M, up 19.7% from the same period in 2023. Debt as a percentage of capital raised on a worldwide basis remained steady at 60.1%, compared to 61.0% last year. U.S. raises accounted for 72.1% of total funds, up from 53.3% at the same point in 2023. Raises from outside Canada and the U.S. represented 4.6% of the total funds raised, falling a little short of the average of 5.6% in the six previous years but is sharply lower than the 10.7% achieved in 2023.
- YTD raises by public companies accounted for 77.4% of total funds, the highest since 2021.
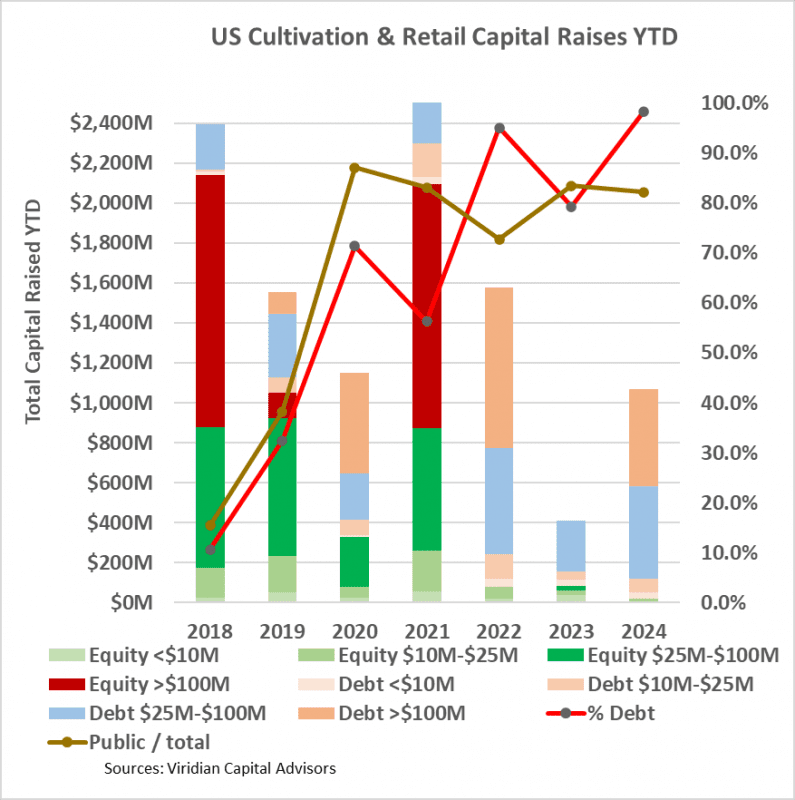
- Cultivation and Retail Sector capital raises are up 161% YTD. Debt accounts for 98.3% of the $1068.1M raised YTD, and around 75% of this was earmarked for refinancing existing debt. Large debt issues (>$100M) bounced back and represented 45.6% of capital raised compared to zero in 2023.
- Cannabis equities (as measured by the MSOS ETF) ended down 8.83% for the week, hitting new all-time lows.
VIRIDIAN INSIGHTS
-
- HOW MUCH EQUITY DOES GLASS HOUSE REALLY WANT TO RAISE?
- Glass House just filed for a $25M equity raise, and honestly, the number feels a little…curious.
- We’ve been saying for a while that there’s virtually no market for plant-touching equities right now. Why? Simple: Prices are near all-time lows, but there are more upside catalysts on the horizon than ever before. No CFO wants to be the guy who raises equity right before his stock doubles, thanks to one of these catalysts finally hitting. So the natural question is: Why now?
- From an investor’s perspective, any company trying to raise equity in this environment screams desperation. But Glass House doesn’t exactly fit the picture. In fact, it jumps out as a valuation outlier, trading nearly 6 EBITDA turns higher than its closest competitor.
- Why Raise Now? Let’s be real: If we were Glass House, trading at 12x EBITDA while everyone else is limping along below 6x, we wouldn’t just be raising $25M—we’d be raising a lot more.
- A logical figure? Something like $83M, enough to wipe out that painfully high-priced preferred stock with its eye-watering 20% dividend rate.
- In a market this rough, every move counts. And while the $25M raise is interesting, it feels more like dipping a toe in the water when Glass House should be cannonballing in.
- HOW MUCH EQUITY DOES GLASS HOUSE REALLY WANT TO RAISE?
- IS THERE A WINNER IN THE CANOPY/ACREAGE DEAL?
- Can we first stipulate that neither company is quite what it used to be when the deal was announced? In April 2019, with Bruce Linton at the helm and fresh off a $4B investment by Constellation, Canopy was flying high. Similarly, Acreage, with founder Kevin Murphy presiding, was enjoying the position of being in more state markets than any other MSO. It would take years to reveal that the ½ inch-deep and a-mile-wide strategy was deeply flawed.
- Flash forward to winter 2024, and neither company looks financially sound. Canopy has never had positive EBITDA despite many promises, and its cash horde has diminished into a net debt position. Meanwhile, Acreage was ranked #28/31 in its last appearance on our weekly credit screen.
- The final deal wasn’t cheap: At 1.40x trailing twelve-month revenues, the multiple was undoubtedly a premium to the current market. But the fact is that if you are getting paid in Canopy shares, you are going to want a premium price.
- So what’s the prognosis? Well, we don’t see any near-term event that will allow Canopy to consolidate its U.S. operations into its financial statements. Still, arguably, its U.S. assets may be its savings grace if it can maintain them until then. In the near term, Acreage may need more of Daddy’s cash. The company’s recent total liabilities to market cap of 82 implies that its assets are only worth about 42% of its liabilities. So, like all out-of-the-money option holders, Canopy wants to keep the game going and roll the dice.
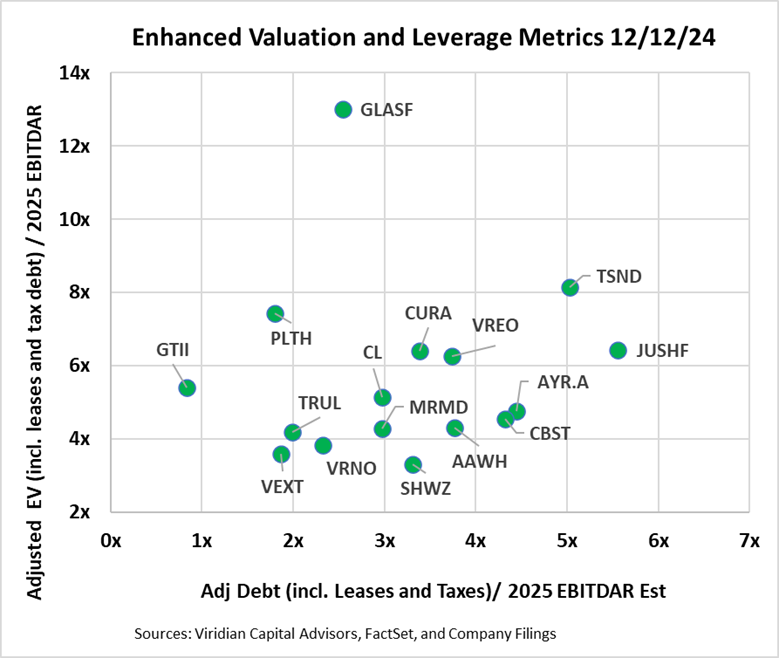
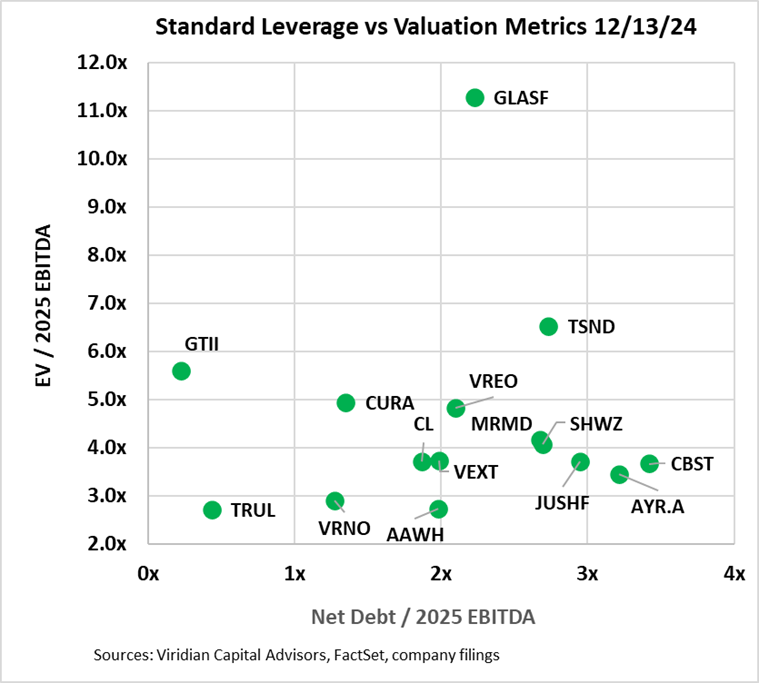
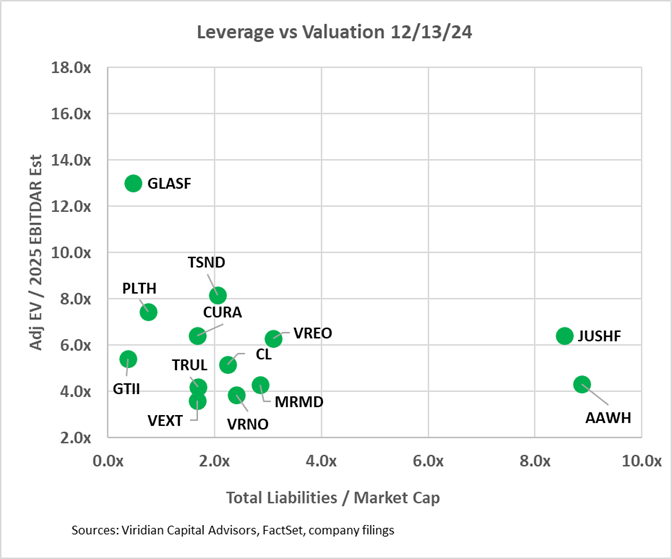
- MSO VALUATION AND FINANCIAL FLEXIBILITY DEPICTED BY FOUR GRAPHS. BOTTOM LINE: MSOs ARE TRADING AT HIGHER VALUATION MULTIPLES AND HAVE HIGHER LEVERAGE THAN STANDARD MEASURES INDICATE!
- The four graphs below seek to map the financial options available to eighteen of the largest MSOs based on their Valuation, Leverage, and Liquidity. We have updated our measures to look at 2025 EBITDAR estimates as we believe most investors are now looking to these values in their valuations.
- The first two graphs present different versions of EV/EBITDA on the vertical axis and Debt/EBITDA on the horizontal axis.
- The first graph presents our latest view of the most appropriate valuation and financial statement-based leverage metrics: Adjusted E.V. / 2025 EBITDAR and Adjusted net debt / 2025 EBITDAR. In calculating Adjusted Net Debt, we make several key assumptions: 1) Leases that are included on the balance sheet are considered debt. We view most leases in the cannabis space as equivalents to equipment loans or mortgage loans. While it is true that a lease default does not necessarily trigger a cascade of events leading to bankruptcy, the distinction is often meaningless in cannabis due to the mission-critical nature of many long-term leases and the absence of bankruptcy protection in cannabis. 2) We consider any accrued taxes (including uncertain tax liability accounts listed as long-term liabilities) in excess of the most recent quarterly tax expense to be debt. Our calculation of enterprise value is now market cap plus debt plus leases plus tax debt minus cash. We now use EBITDAR rather than EBITDA since lease expense is taken out prior to EBITDA.
- The second graph utilizes EBITDA and employs the traditional calculations of both debt and enterprise values, leaving out leases and taxes.
- Our adoption of new metrics tends to make the companies look less cheap and more leveraged.
- Surprisingly, eight of the companies on the enhanced metric chart are still above 3x leverage, which we have identified as the boundary of sustainability in a 280e environment. Four companies now exceed 4x leverage, which we believe will be close to the maximum sustainable post 280e.
- Valuation metrics can be deceiving when a company is just achieving positive cash flow status. Glass House, for example, has enormous valuation multiples. Still, it is based on small EBITDAs that are likely to expand significantly in the next several years.
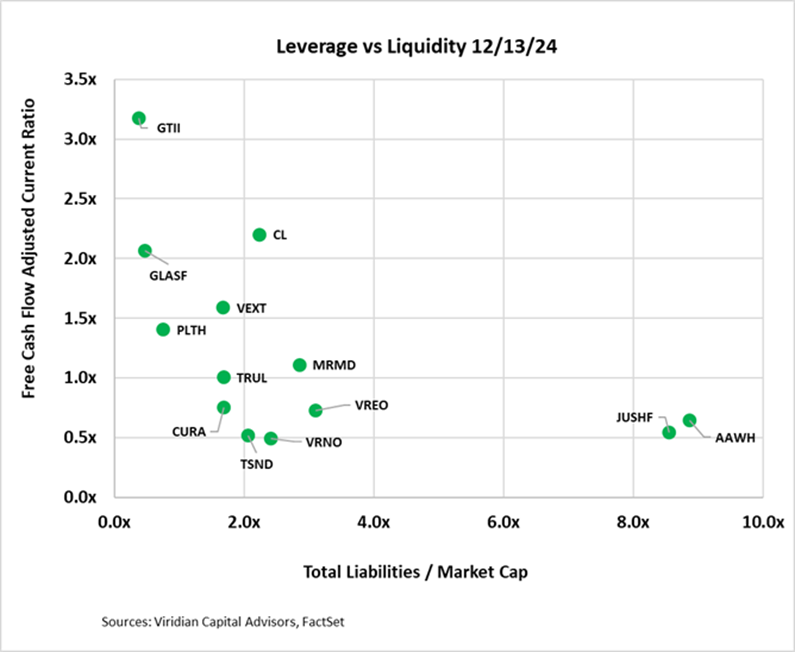
- The third graph looks at leverage through the lens of total liabilities to market cap. We believe this is the single best measure of leverage because it is a direct reflection of the market’s assessment of the value of a company’s assets in excess of its liabilities and is sensitive to changes in market perception of a company’s future.
- On the bottom left are companies with Adj E.V./2025 EBITDAR of under 7x and total liabilities to market cap under 2x. The group includes Vext, GTI, PLTH, Verano, and Cresco. Companies in this quadrant are right to consider stock repurchases or using cash in acquisitions. They can afford some additional debt and can take advantage of the ongoing dislocation in equity prices.
- In the middle, between 2x and 5x total liabilities/market cap, we see Ascend, AYR, Jushi, and MariMed. Each of these has significant upside catalysts that could mitigate or exacerbate the excess leverage. However, several upside catalysts seem to be neutralized in the short run. Florida rec is indefinitely delayed, PA rec does not seem to be happening this year, and VA rec is probably on hold until 2026.
- On the right lies Jushi, AYR, Ascend, and Schwazze (not pictured). AYR has moved into our danger zone, but its metrics are not nearly as troublesome as the Schwazze. At the top left are companies with high valuation metrics and low leverage. These companies should look to do an equity issuance depending on their positioning in the liquidity graph below.
-
-
- The fourth graph introduces the free cash flow adjusted current ratio liquidity measure into the mix. Companies with less than 1x on this measure will likely have to raise capital next year. Surprisingly, eight of the companies fall into this bucket (including Schwazze, not pictured).
- The bottom left group, including Curaleaf, Verano, and Vireo, has low leverage but is below the critical 1x liquidity level. This suggests that Curaleaf and Verano should take advantage of the robust debt market to augment their liquidity. Vireo is a more challenging call. Their adjusted net debt/ EBITDAR is relatively high, which makes them an unlikely net debt issuer and suggests asset sales.
- On the top left, we find companies with adequate liquidity and low market leverage, including both GTI and Planet 13.
- Companies in the lower middle-to-right generally have constrained liquidity and high leverage, a potentially dangerous combination in a capital-constrained environment. Cannabist’s liquidity is understated in the graph and is likely to be OK based on announced asset sales. 4Front and Schwazze (both not pictured because they are off the scale to the right), despite making moves to restructure their debt, continue to have inadequate liquidity and excess leverage and should be watched carefully. We note that FFNT has no consensus on 2025 EBITDA estimates, but a full year of Illinois cultivation will probably make leverage look significantly better.
-
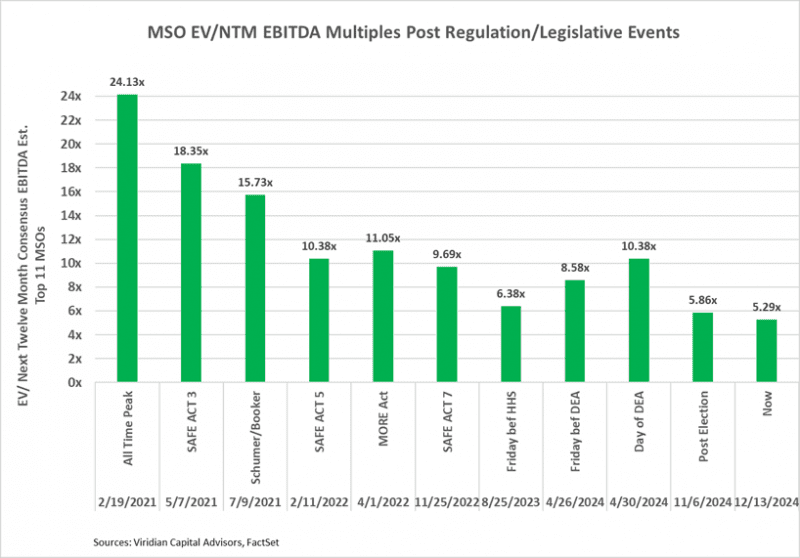
- EV/LTM MULTIPLES ARE NOW LOWER THAN BEFORE THE ORIGINAL HHS RESCHEDULING ANNOUNCEMENT ON 8/30/23
- We continue to believe that at current levels, U.S. MSOs have enormous upside potential. The graph below shows the multiples reached after a number of past legislative/regulatory events. It makes clear that a doubling of prices is a reasonable assumption. We recommend a balanced portfolio that leans toward the companies in the top half of the Viridian Credit Tracker model ranking.
- Despite the challenges to growth discussed above, we believe that many companies have become stupidly cheap. We recommend a “don’t step in the doggy do do” strategy. With refinancing risks made worse by cratering stock prices, this is no time to be a hero. Focus on building a diversified portfolio of companies ranked in the top 10 in our credit rankings. Put them in your portfolio and follow the total liabilities to market cap indicator that we recommended several weeks ago, as well as the credit tracker rankings. And resist the urge to look at the stock prices every day!
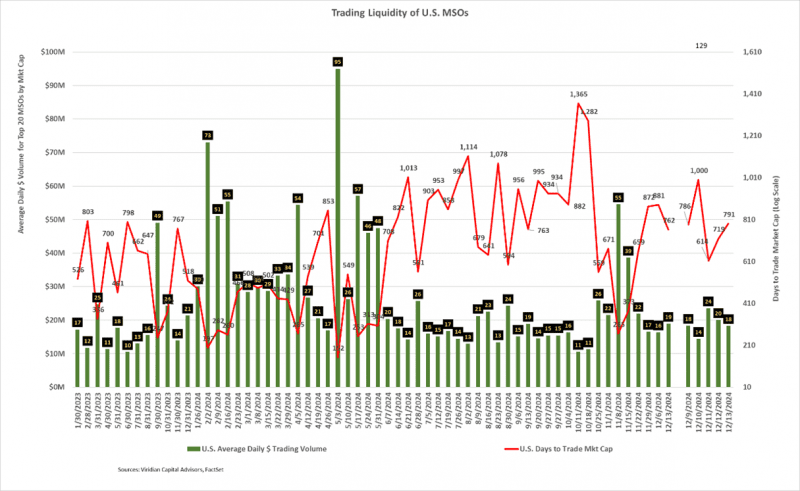
- AFTER A BRIEF FLURRY, TRADING LIQUIDITY IS BACK TO NORMAL (POOR).
- The average daily dollar volume of $19M for the week ending 12/13/24 is in line with recent volumes.
- The Days to Trade Market Cap (DTTMC) series depicts the number of days it would take to trade the market cap of a stock or group of stocks. The current DTTMC of 762 implies that an investor who acquired a 5% position in the stock, assuming he wanted to be less than 25% of the average daily dollar volume, would require 152 days to trade out of his position.
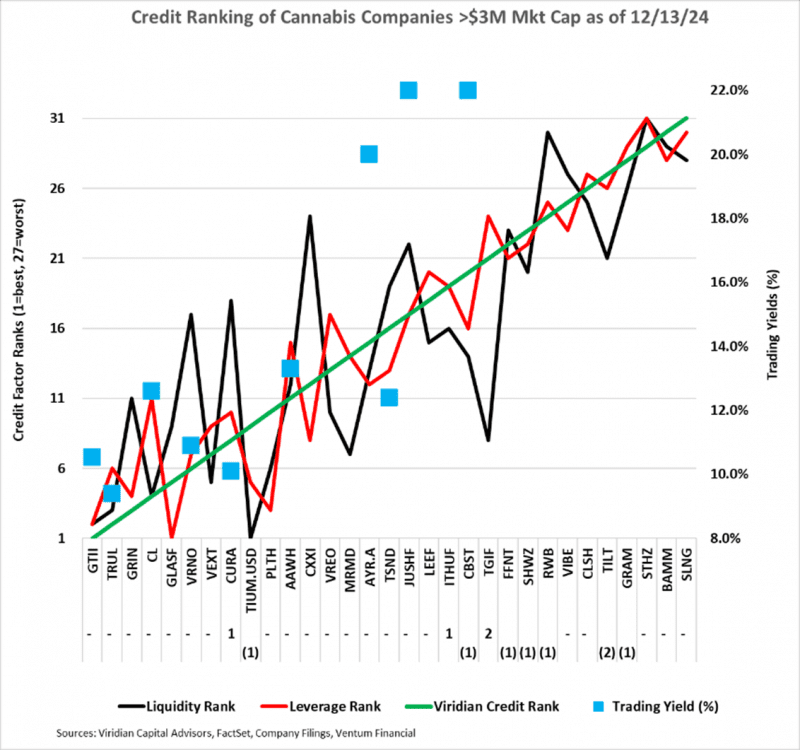
- GIVING CREDIT WHERE CREDIT IS DUE
- The chart below shows our updated 12/13/24 credit rankings for the 30 U.S. cannabis companies with over $3M market cap. The number below the ticker symbol indicates the change in credit ranking since last week, where a negative number suggests credit deterioration, while a positive indicates improvement.
- The blue squares show the offered-side trading yields for each Company. The prices shown have become a bit dated, so we will consider them only indicative. We expect updated pricing to reflect the dislocations observed in the equity market.
- We have replaced Acreage with Vibe at the beginning of this week.
- AYR has become the poster child of the 2026 debt “tsunami.” We generally don’t think the 2026 issues are nearly as severe as the press has made out, but AYR may be an exception. There are no near-term debt triggers because the company’s maturities have substantially been pushed out to December 2026. However, the approximately $300 million of 2026 maturities now represent 3.7x the company’s market cap, compared to 1.1x on 11/1/24. The 3.7x exceeds the level of maturity AYR faced at the end of 2024 before it conducted a somewhat disastrous restructuring/refinancing deal. Our latest work on asset coverage of liabilities did not provide comfort. AYR’s total liabilities to market cap implies a market belief that the company’s assets are only worth less than 60% of its liabilities. This week, Tilray announced that AYR’s interim CEO had joined the Tilray board. Does that signal an upcoming transaction? It seems hard to believe they could announce one piece of news if the other would be forthcoming.
But a transaction doesn’t seem totally crazy to us.
- Cannabis equities (as measured by the MSOS ETF) ended down 8.83% for the week, hitting new all-time lows.

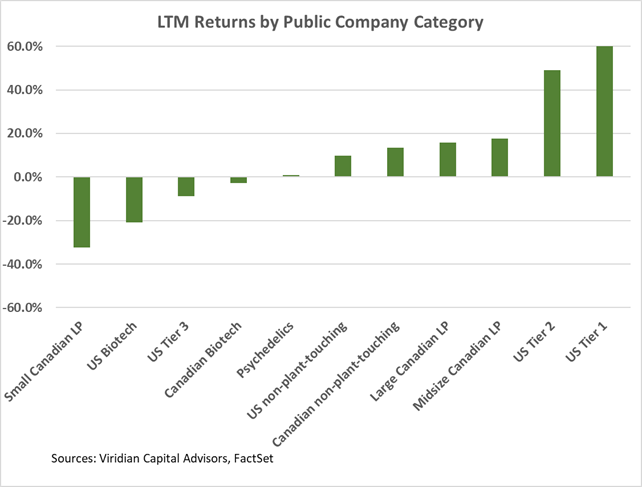
Trailing 52-Week Returns by Public Company Category:
-
- U.S. Tier 1s are now down nearly 50% over the LTM period versus a 30% gain on the tier 3s, consistent with a multi-year low in the valuation gap, our measure of large vs small company multiples.
Best and Worst Performers for the week:
- Schwazze (SHWZ: CSE) was the worst performer of the week, down 82% on the declaration of a default on the company’s senior secured notes due to the inability to file financial reports on a timely basis. The company’s previous auditor was disqualified by the SEC, and the company is now waiting for Baker Tilly to restate 2023 and YTD 2024 results.
- Body and Mind (BAMM: CSE) was the week’s biggest gainer, up about 49% on news that the company’s audit is nearing completion, allowing for the release of its financials for the year ended July 31, 2024.