OUR 9TH YEAR OF PROVIDING PROPRIETARY CAPITAL MARKETS INTELLIGENCE ON THE CANNABIS / HEMP / PSYCHEDELIC SECTORS
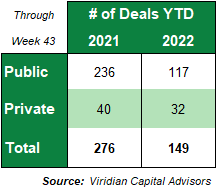
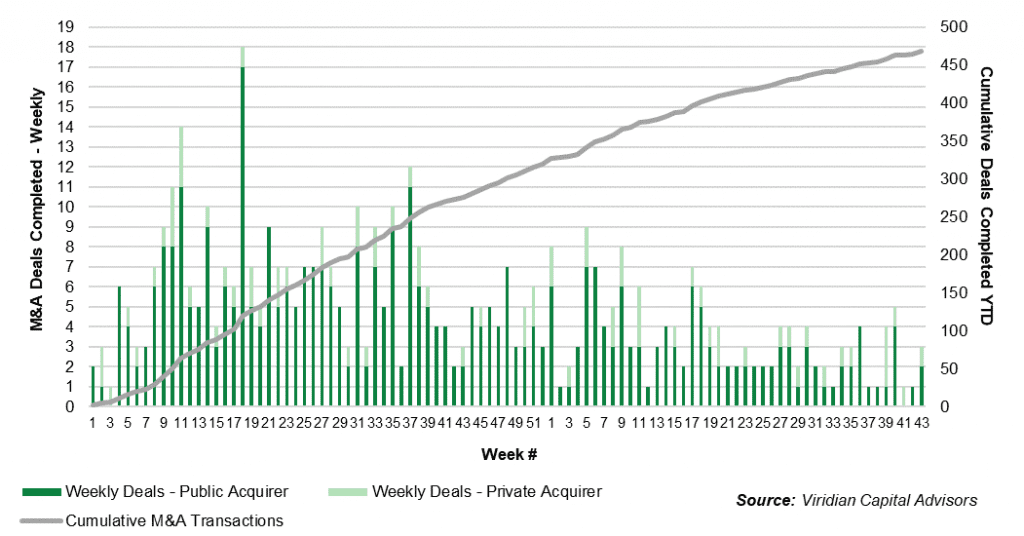
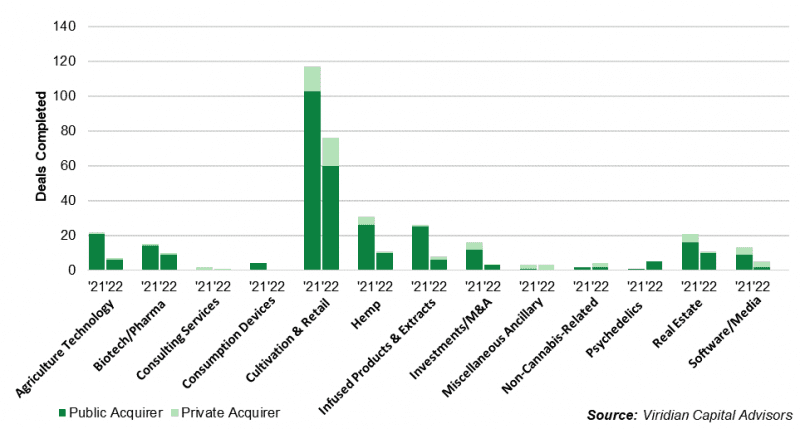
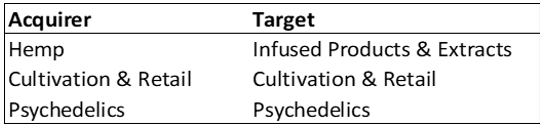
The Year-to-Date Charts for M&A include a detailed breakdown of M&A activity in the industry year to date, and as compared to prior year periods. This provides insight into M&A activity over time and the underlying trends driving M&A transactions. Charts include a breakdown between Buyer & Seller, Public & Private Companies and Industry Sector.
The Viridian Capital Chart of the Week highlights key investment, valuation, and M&A trends taken from that week’s Deal Tracker that we believe are impactful for investors, companies and acquirers.
Since its inception in 2015, the Viridian Cannabis Deal Tracker has tracked and analyzed more than 2,500 capital raises and 1,000 M&A transactions totaling over $50 billion in aggregate value. The Deal Tracker has been the leading data service analyzing and reporting on Capital Raise, Investment, and M&A Transactions in the Cannabis/Hemp industries. The data/market intelligence in the Tracker is used by companies, investors and acquirers to make informed capital allocation decisions.
Value Add for Companies, Investors and Acquirers. Our weekly deal tracker displays the most pertinent information and analysis of the three key areas of cannabis capital markets: equity raises, debt raises, and M&A transactions. No other data source brings all the relevant information together in one concise report with a deep level of detail and analysis.
– By Industry Sector. Provides visibility into which industry sectors are in/out of favor, analyzes flow of funds
– By Public vs. Private Company. Provides visibility into capital allocation and acquisition activity by company type
– By Equity vs. Debt. Analyzes terms, structure, pricing and valuations of both equity and debt financings
– By Buyer vs. Seller. Analyzes buy and sell-side M&A activity, including terms, structures and valuations
– By State/Region. Analyzes transactional activity by state and region to provide forward intelligence for investor allocations