Each week, Viridian publishes insights and analysis on completed capital raise transactions in the prior week, focusing on all equity and debt deals. Our analysis includes:
- Summary
- Outlook
- Best & Worst Perfromers
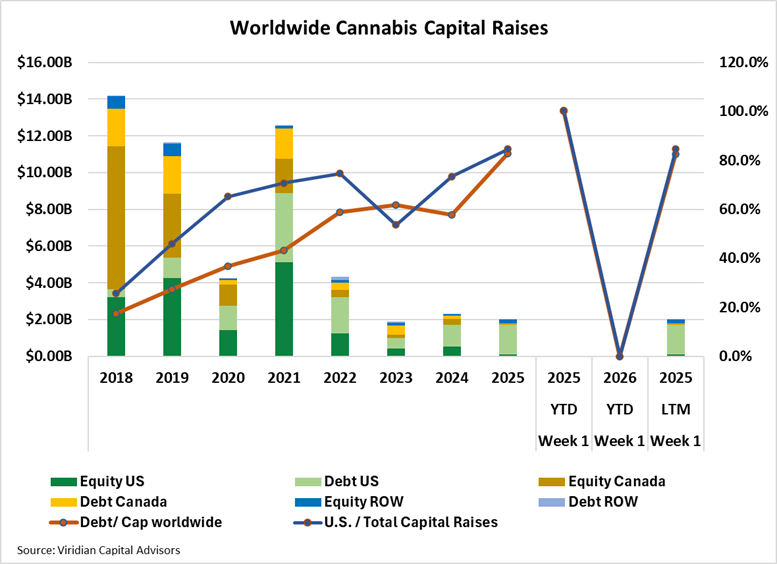
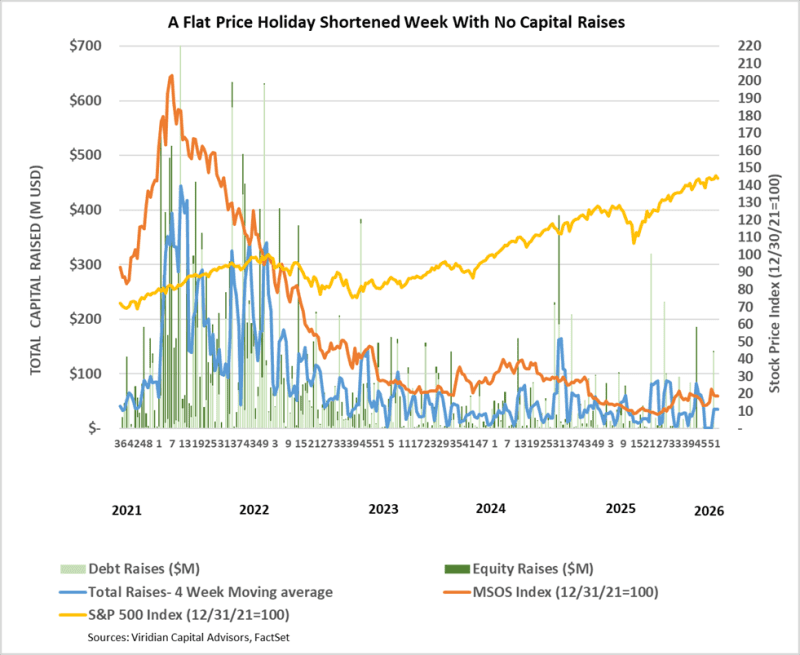
- From an LTM view, capital raises totaled $2.0B, down 13.4% from the same period in 2025. Debt as a percentage of capital raised worldwide is 82.6%, compared to 57.8% in the previous year. U.S. raises LTM accounted for 84.6% of total funds, up from 73.4% at the same point in 2025. Raises from outside Canada and the U.S. accounted for 11.2% of total funds raised, more than double the average of 5.3% over the six previous years.
- Public company raises accounted for 93.1% of total raises in the LTM period, the highest in at least the last 7 years.
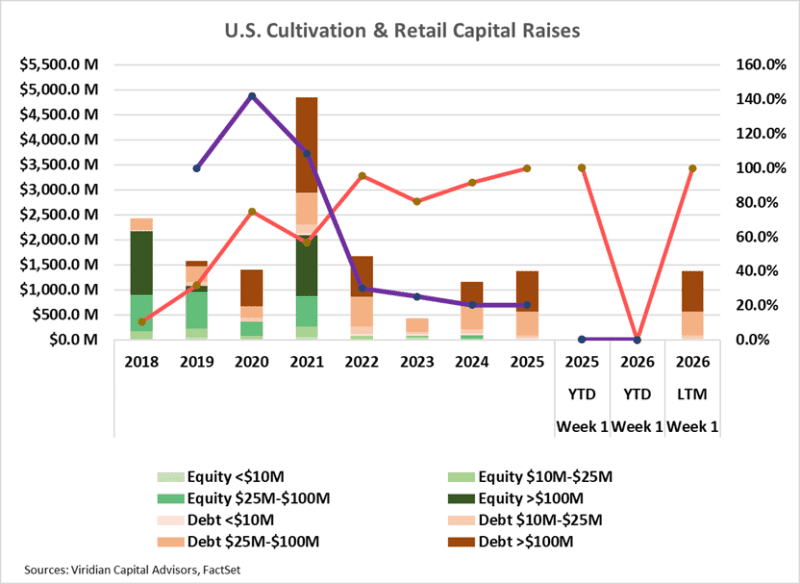
- For the LTM period, the capital raised in the cultivation and retail sector was $1.37B, 18.5% higher than in 2024, which in turn was 160% higher than in 2023.
- Debt accounts for a whopping 99.7% of the funds raised over the last 12 months (LTM). Large debt issues (over $100M) accounted for 59.3% of capital raised, up from 0% in 2023.
- Cannabis equity prices (as measured by the MSOS ETF) fell by 0.4% for the week.
VIRIDIAN INSIGHTS
-
- WYLD ANNOUNCED AN ACQUISITION OF GRON IN THE FIRST BLOCKBUSTER BRAND DEAL
- WYLD, the most recognized and largest cannabis edibles brand, with 2025 revenues of approximately $352M, is acquiring GRON with revenues of nearly $88M, (according to data from Hoodie Analytics http://hoodieanalytics.com/) to create an edibles monster over two times the size of its nearest competitor and with more revenues than all but the top six MSOs
- Financial Terms of the Transaction were not disclosed.
- One of the key drivers of the deal is the ability to take GRON from its 9-state footprint into WYLD’s 16 State and Canada footprint.
- The deal will also expand the combined product offering to include everything from real-fruit gummies to chocolates and rosin-based products.
- The companies are avoiding combining the brands or making any changes to the individual product line-ups and brand identities, thereby avoiding one of the potential pitfalls of brand combinations – the dilution, if not destruction, of the unique brand characteristics that build their success.
- We think more brand consolidation is likely, as it facilitates two key mandates: expansion into new states and product line extensions. A larger scale will also add leverage to supplier and distribution negotiations.
- CANNABIST GETS A BETTER DEAL FOR VIRGINIA
- Cannabist announced that it was canceling its deal with Curealef and accepting a higher offer from an affiliate of Millstreet Credit Fund LP.
- The total consideration of $130M will consist of $117.5M in cash paid at closing, with $12.5M escrowed to satisfy potential indemnification obligations.
- The rumored (but not substantiated by the company) EBITDA of the Virginia assets is $20-$22 million, giving the acquisition a multiple of 5.9x-6.5x.
- One interesting twist is that the single sell-side analyst covering the company has a 2026 EBITDA estimate of $19M. If the Virginia assets have an EBITDA contribution of $20M, then the remaining assets have breakeven EBITDA. With $270M of newly restructured notes available for paydown, approximately ½ will be redeemed at par, leaving the other half to be serviced by a company with zero EBITDA? Calls and emails to the company for verification were not returned by press time.
- One unknown is how much of the debt is under Millstreet’s control. In a way, this is similar to an Article 9 foreclosure. Certain “good” assets are selected and subject to a credit bid by creditors, while others are left to fend for themselves and may be liquidated.
- Presumably, a significant slug of Millstreets’ debt will be redeemed by the proceeds of the sale, but we are missing how any coordination with other members of the credit group will work here.
- The article 9 process was staring us in the face all along, but we did not see it here, and maybe we should have.
- TRUMP SIGNS EXECUTIVE ORDER, REBOOTING THE RESCHEDULING PROCESS AND MORE
- The Executive Order directs the Attorney General to complete the rulemaking to move marijuana from Schedule I to Schedule III under the Controlled Substances Act.
- Rescheduling to S3 will eliminate 280E taxation, significantly boosting valuations:
- Directly increases the free cash flow available for discounted cash flow analysis
- Makes interest expense deductible, reducing the weighted average cost of capital (WACC) used to discount cash flows.
- Further, “normalizing cannabis, will, over time, reduce the risk premium to cannabis investment.
- S3 will improve the credit capacity of cannabis companies:
- Viridian estimates indicate that eliminating 280E will increase sustainable debt levels by at least 1.5 turns of EBITDA. Companies that are struggling with their current debt loads will get a bit of a breather. In contrast, companies that are already doing well will find available cash or credit to pursue productivity-enhancing capex.
- Rescheduling will reopen the cannabis equity capital market and foster increased M&A activity:
- The cannabis equity market has been in virtual lockdown due to the uncertainty about regulatory reform. Investors were rightfully suspicious of any company willing to issue equity at historically low multiples, and issuers were reluctant to sell equity at prices below intrinsic value. The result has been that over 90% of all plant-touching capital raises in the last 3 years have been debt. This has pressured balance sheets to levels that are often dangerous. We believe companies will take advantage of stock price increases to repair their balance sheets and prepare for future growth.
- An uptick in M&A activity will foster greater consolidation. Companies have been reluctant to use their stock as acquisition currency, and capital markets have been difficult to access. S3 will ease both of these conditions, leading to more M&A activity, particularly intrastate acquisitions aimed at increasing depth in existing markets.
- The Executive Order aims to increase cannabis research
- Medical cannabis will be revived as a significant growth engine as new research-driven medications come to market.
- Trump’s order addresses recent legislative overreaction to hemp and CBD
- The Trump administration will work with Congress to update definitions that affect full-spectrum CBD.
- Seeks clearer federal standards, more accurate labeling, and stronger consumer safeguards.
- Trump emphasized the use of cannabinoids in improving care for chronic pain patients, seniors, and veterans.
- Notes potential opioid-reduction effects among medical marijuana users.
- Emphasizes risk management for seniors and polypharmacy patients.
- One of the biggest news items wasn’t in the Executive Order.
- During the signing of the Order, Dr. Mehmet Oz announced the launch of the Center for Medicare and Medicaid Innovation (CMMI) pilot program that allows federal reimbursement for qualified, non-intoxicating hemp-derived CBD products, primarily for senior oncology patients.
- This marks a historic federal shift toward integrating evidence-based CBD into senior healthcare.
- In the face of so much seemingly good news, why has the market reacted negatively?
- Trump put S3 back on the path to enactment, but it is not there yet. We believe that, based on Trump’s instructions, S3 will be enacted in the first half of 2026, but the market is skeptical of any politician’s claims on the matter. We have simply seen this movie too many times.
- There was rampant speculation prior to the announcement that elements of Federal Banking Reform would be included, and they were not. This leaves action on some version of SAFER still necessary to fully open the market to institutional investors, and potentially allowing uplisting.
- The regulated cannabis market was bothered by the amount of time and space that the Executive Order devotes to CBD and Hemp, and the fact that it explicitly talks about walking back some of the anti-hemp actions from recent legislation. Regulated cannabis players fear that hemp is getting a reprieve and will be allowed to compete under more lenient rules.
- Finally, there was a bit of “buy on rumor, sell on news” effect, as parts of the order had been leaked for at least a week before the actual announcement.
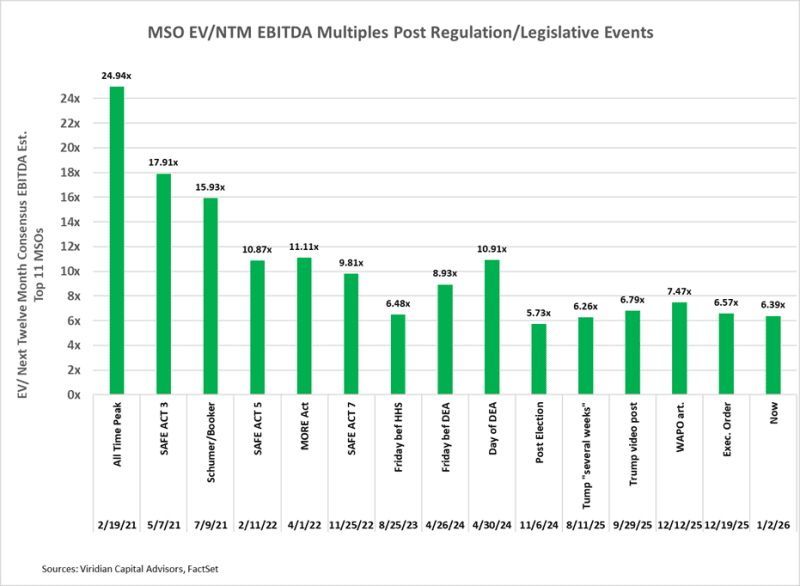
- The good news is that the uncertainty creates an opportunity for investors to establish positions ahead of what we believe will be a very significant uprating in cannabis stocks. The charts below show the potential upside.
- WYLD ANNOUNCED AN ACQUISITION OF GRON IN THE FIRST BLOCKBUSTER BRAND DEAL

-
- SUPREME COURT DECLINES TO HEAR CANNA PROVISIONS CASE
- On December 15, 2025, the U.S. Supreme Court declined to hear the case of CANNA PROVISION, INC. ET AL VS BIONDI. We carried a full analysis of the potential impacts of the case in last week’s Tracker, which is now moot.
- The Court hearing the case was always an outside chance, but one that, if the plaintiffs fully prevailed, would have essentially descheduled cannabis for interstate commerce.
- Trump’s announcement that he is strongly looking at rescheduling to S3 was perfectly timed to reduce the chances of the Court hearing the case, since it would be acting ahead of the likely upcoming federal reform.
- Cannabis stocks barely reacted, as no positive results were baked into prices.
- ANALYSTS ARE QUITE UPBEAT ABOUT 2026
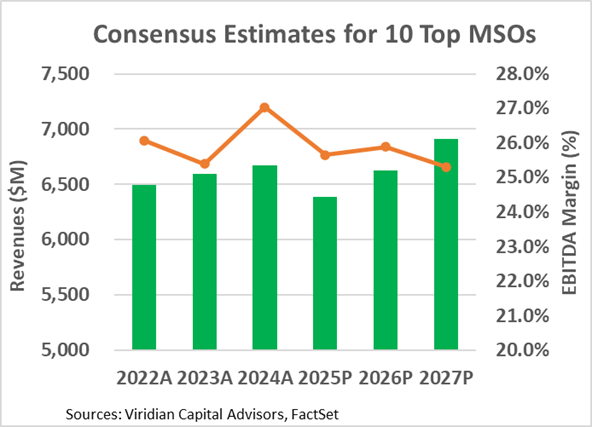
- The Chart below shows historical and consensus revenue and EBITDA margin estimates for the top 10 MSOs for 2022 through 2027. Note that after a projected 4.2% decline in revenues in 2025, analysts are projecting a 3.8% increase in 2026. Aggregate margins are also projected to strengthen slightly, resulting in 4.7% EBITDA growth, a significant improvement from the 9.1% decline projected for 2025. So the bottom line is that companies are adapting to the environment and figuring out how to improve their operating profitability despite the headwinds we face.
- It is unclear which new adult rec states are included in analyst projections. Still, it appears to us that very little of the impact of PA, VA, or FL is included, and together, any one or combination of these could provide significant further upside.
- SUPREME COURT DECLINES TO HEAR CANNA PROVISIONS CASE
-
- THE 2026 DEBT MATURITY WAVE IS LOOKING LESS THREATENING: THE COMPANIES WITH THE RISKIEST REFINANCINGS HAVE ALREADY GONE INTO RECEIVERSHIP, NEGOTIATED AN EXTENSION, OR ARE PREPARING AN ARTICLE 9 SALE OF ASSETS TO CREDITORS
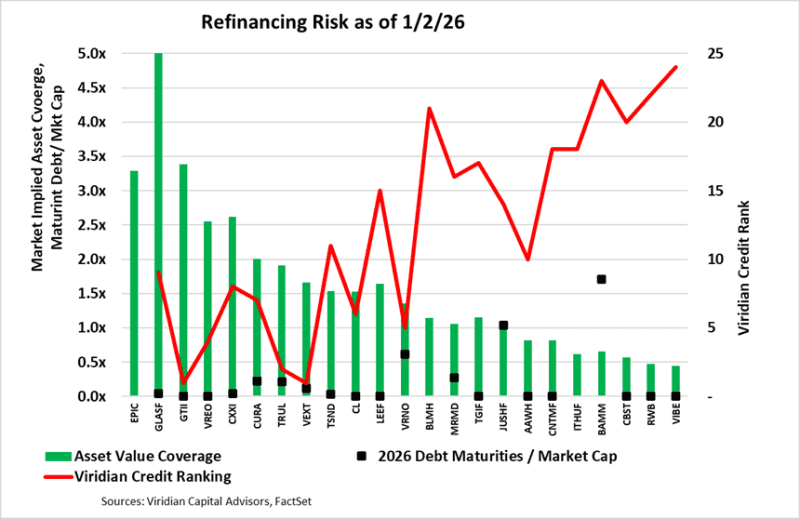
- Much has been made of the upcoming wave of cannabis debt maturities in 2026. The sheer Size is undoubtedly intimidating. The companies pictured on the graph below collectively have approximately $1.5 billion of debt maturing in 2026. (IAnthus maturities are actually in 6/27, but close enough!). This figure used to be over $2.3 billion, before Gold Flora, 4Front, AYR, and Shwazze flamed out. Meanwhile, Cresco agreed to refinance its secured term loan, and Trulieve has announced it is calling its 2026 debt at the end of 2025. Putting the $1.53B figure into perspective, it is more than total cultivation & retail sector capital raises for any year since 2019, except for 2021 ($4,8B) and 2022 ($1.7B)
- Viridian is more constructive about the issue than most other industry observers. We observe that in the high-yield bond market, it is virtually never the case that debt is paid off in cash. It is generally refinanced, OR the company is forced to restructure. Obviously, given the lack of prepackaged bankruptcy (or any bankruptcy, for that matter), restructuring is rightfully a prospect to be feared in the Cannabis Industry.
- So, how do we gauge the risk of something going wrong in 2026? Refinancing risk is a peculiar mixture of market psychology and financial realities.
- The green bars show the 12/19/25 market-implied asset coverage of total liabilities. We arrive at this by viewing the equity as a call option on the firm’s asset value, with a strike price equal to its liabilities, and assuming a maturity of 2026, 30% volatility, and a risk-free rate of 4.25%. This provides us with all the elements of the Black-Scholes option-pricing formula except the current asset value. By iterating on the BS model, we can determine the market’s assumption about asset value. The importance of this data point should be obvious. For companies with less than 1x asset coverage of liabilities, debt providers are effectively making an equity bet. They do not have adequate asset value coverage to fall back upon.
- The red line represents the Viridian Capital credit ranking, which considers four key credit factors: Liquidity, Leverage, Profitability, and Size. Refinancing will be more difficult for weaker credits (higher numbers). Companies with ranks of under 12 are in the top half of the Viridian-ranked universe of credits.
- The black dots represent the multiples of market cap for the 2026 debt maturities. Clearly, the larger the debt maturities relative to the market cap, the more difficult refinancing would be.
- The companies to the right of Jushi (JUSHF: OTCQX) on this graph represent higher risk. They have less than 1x asset coverage, generally poor Viridian Credit Ranks, and several, such as IAnthus and Body & Mind, have maturing debt that is multiples of their market capitalization. Companies in this position represent only about $170M of the maturing debt.
- Conversely, the companies on the left-hand side of the graph represent lower refinancing risk. They have solid asset coverage, strong Viridian Credit Ranks, and maturing debt that is less than 1.25x times their market capitalization. These companies represent $1.36 billion of the $1.53 billion total (70%), and we believe they should all be able to refinance their maturities without undue hardship. The offered side quotes on Curaleaf, Verano, and Trulieve—the solid credit MSOS with the most remaining 2026 maturities—tightened significantly after the Cresco deal. Investor psychology appears to have shifted, with a growing belief that these names can refinance their maturities without undue hardship.
- THE 2026 DEBT MATURITY WAVE IS LOOKING LESS THREATENING: THE COMPANIES WITH THE RISKIEST REFINANCINGS HAVE ALREADY GONE INTO RECEIVERSHIP, NEGOTIATED AN EXTENSION, OR ARE PREPARING AN ARTICLE 9 SALE OF ASSETS TO CREDITORS
-
- HOW MUCH OF THOSE 280E SAVINGS WILL FIRMS ACTUALLY BE ABLE TO KEEP?
- Every analysis we have seen regarding the impact on credit capacity, valuation, or growth from the elimination of 280E begins with a simple yet probably incorrect assumption: that the tax savings from eliminating 280E will flow directly to free cash flow.
- This is clearly not the case, however. Some of the savings, and possibly the majority, are likely to be passed through to consumers via lower prices.
- One historical example that demonstrates this point is the 2022 elimination of the cultivation tax in California. The $ 161-per-pound tax equated to roughly 10-15% of the value when pounds were clearing at $1,000-$1,500 per pound. However, according to figures from MJBIZ, California production revenue dropped nearly 27% in 2022, more than offsetting the excise tax benefit. The hoped-for shot in the arm for California cultivators never happened.
- The ability to retain tax savings varies significantly across markets. Operators in markets with many competitors and a vibrant illicit market are likely to keep very little of the savings. On the other hand, lower prices may allow a recapture of sales from the illegal market. The net impact can be approximated based on two variables: the number of competitors in the market and the price elasticity of demand.
- The Cournot model is a simple economic model that describes competition when firms sell a relatively undifferentiated product. Each firm chooses the quantity it will produce, assuming rivals’ outputs are fixed, knowing that the market price will be whatever clears the market at the total amount produced. The strategic “best responses” to one another’s quantities define a Nash equilibrium: with few firms, each has market power (the price stays above the cost), and as the number of firms N increases, the outcome drifts toward perfect competition. In the symmetric, linear-demand case, it gives clean rules of thumb: firms will retain only 1/(N+1) of the tax savings, where N is the number of competitors in the market.
- There is another side to the story, though. The other variable in our analysis, the price elasticity, determines the degree to which firms will recapture sales from the illicit market. If the elasticity is below 1, sales react weakly to a price change, whereas if e > 1, sales react strongly to a price change. We have modeled e at 0.6, 0.9, and 1.2 to correspond with our assumptions of N = 5, 10, and 50. Each set of beliefs about N and e defines a market type.
- The Chart below shows that in oligopolistic markets with few competitors and low price elasticity, firms will retain around 22% of the tax savings. Around 17% of that comes from tax savings not passed through to consumers, while the other 5% comes from the extra FCF from incremental sales from the illegal market. The situation is reversed in markets with many competitors and high elasticity: only 2% of tax savings is retained, but incremental FCF equivalent to 12% of the tax savings comes from recaptured illegal sales.
- The bottom line is that modeling based on reasonable assumptions suggests that, while S3 remains quite positive for the industry, the impacts are likely overstated.
- HOW MUCH OF THOSE 280E SAVINGS WILL FIRMS ACTUALLY BE ABLE TO KEEP?

-
- MEASURES OF MSO VALUATION, LEVERAGE, AND LIQUIDITY
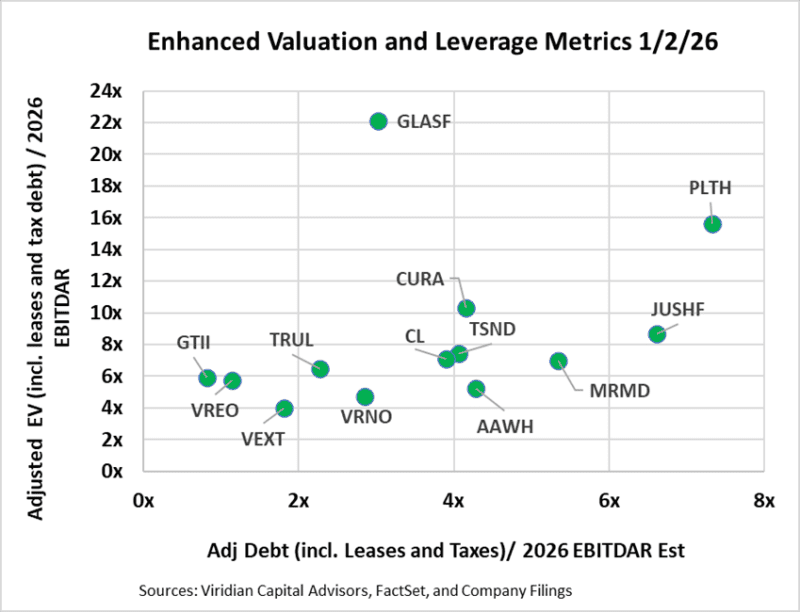
- The first two graphs present different versions of EV/EBITDA on the vertical axis and Debt/EBITDA on the horizontal axis.
- The first graph presents our latest view of the most appropriate valuation and financial statement-based leverage metrics: Adjusted Enterprise Value (EV) / 2026 EBITDAR and Adjusted Net Debt / 2026 EBITDAR. In calculating Adjusted Net Debt, we make several key assumptions: 1) Leases that are included on the balance sheet are considered debt. We view most leases in the cannabis space as equivalents to equipment loans or mortgage loans. While it is true that a lease default does not necessarily trigger a cascade of events leading to bankruptcy, the distinction is often meaningless in the Cannabis Industry due to the mission-critical nature of many long-term leases and the absence of bankruptcy protection in This Sector. 2) We consider any accrued taxes (including uncertain tax liability accounts listed as long-term liabilities) in excess of the most recent quarterly tax expense to be debt. Our calculation of enterprise value is now market cap plus debt plus leases plus tax debt minus cash. We now use EBITDAR rather than EBITDA, as lease expense is deducted before EBITDA is calculated.
- Our adoption of new metrics tends to make the companies look less cheap and more leveraged.
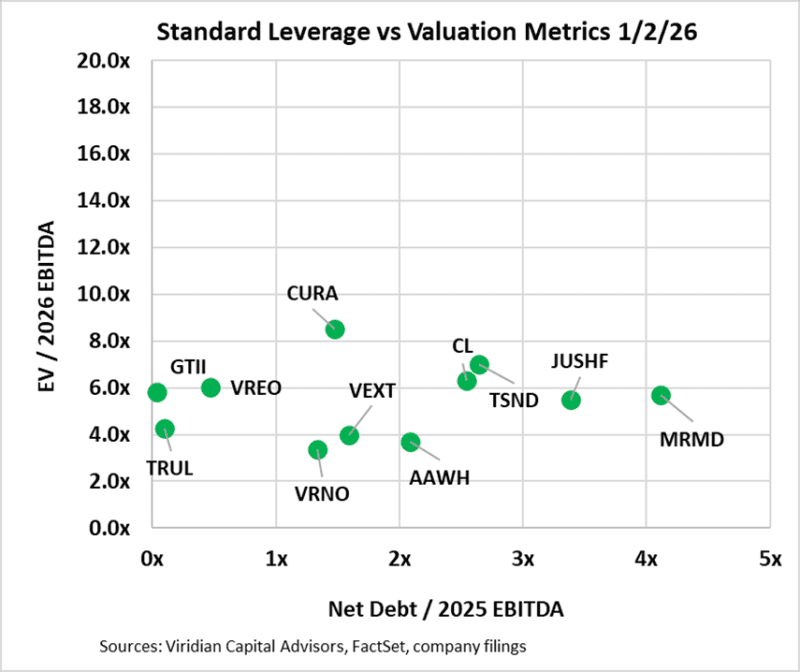
- The second graph utilizes EBITDA and employs traditional calculations for both debt and enterprise values, excluding leases and taxes.
- Surprisingly, nine of the companies on the enhanced metric Chart are still above 3x leverage, which we have identified as the boundary of sustainability in a 280e environment. Five companies now exceed 4x leverage, which we believe will be close to the maximum sustainable post-280E.
- Glass House is a valuation outlier. We have been positive on Glass House for quite a while, but the multiple spread to the nearest competitor is straining our resolve.
- MEASURES OF MSO VALUATION, LEVERAGE, AND LIQUIDITY
-
-
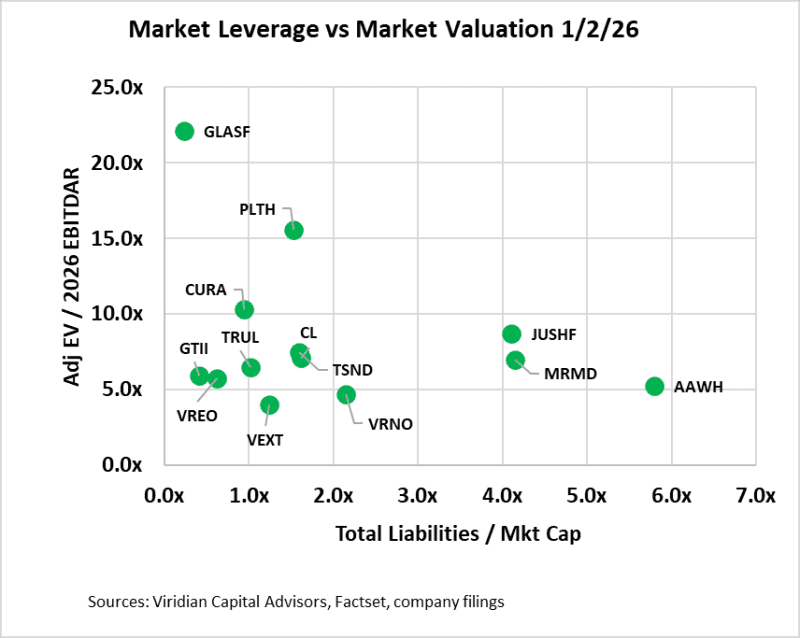
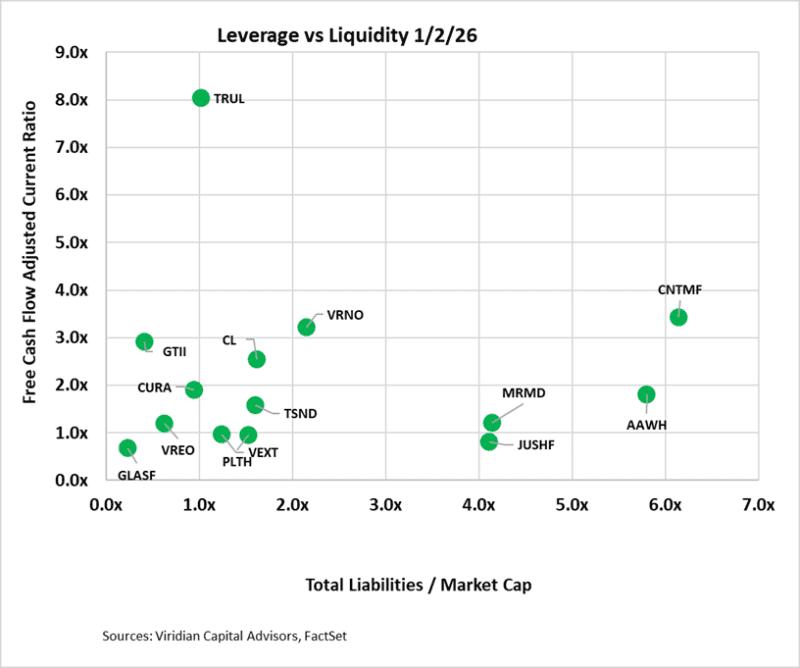
- The third graph examines leverage through the lens of total liabilities to market capitalization. We believe this is the single best measure of leverage because it reflects the market’s assessment of a company’s assets in excess of its liabilities and is sensitive to changes in the market’s perception of a company’s future prospects.
- On the bottom left are companies with an Adj. EV/2025 EBITDAR ratio of under 9x and total liabilities to market cap of under 2x. The group includes GTI, Vireo, Trulieve, Verano, Cresco, TerrAscent, and Vext. Companies in this quadrant are right to consider stock repurchases or using cash in acquisitions. They can afford some additional debt and can take advantage of the ongoing dislocation in equity prices.
- Between 2x and 5x total liabilities to market cap, we find MariMed, Ascend, and Jushi. Jushi is interesting because its liabilities include nearly equal amounts of 2026 debt maturities and uncertain tax liabilities.
- On the right lies Cannabist (off the Chart to the right) with well over 10x, a range that indicates distress. Ascend appears to be looking much better than it did three weeks ago, thanks to its stock rally.
- The third graph examines leverage through the lens of total liabilities to market capitalization. We believe this is the single best measure of leverage because it reflects the market’s assessment of a company’s assets in excess of its liabilities and is sensitive to changes in the market’s perception of a company’s future prospects.
-
-
-
- The fourth graph introduces the free cash flow adjusted current ratio liquidity measure into the mix. Note that we have recently modified our treatment of this ratio by removing uncertain tax liabilities from current liabilities, where they were previously placed. The result is that only Jushi and Cannabist are significantly below 1x free cash flow adjusted current ratio.
- On the top left, we find companies with adequate liquidity and low market leverage. Companies in the lower right generally have constrained liquidity and high leverage, a potentially dangerous combination in a capital-constrained environment.
-
-
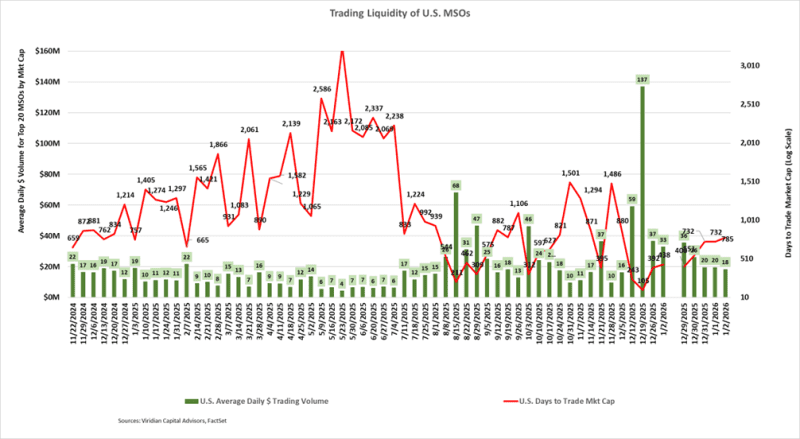
- VOLUME SETTLES BACK TO A LOWER PACE IN THE HOLIDAY SHORTENED WEEK
- The average daily dollar volume of $37 million for the week ending December 26, 2025, was reduced by the holiday-shortened week but is still quite respectable. The current Days to Trade the Market Cap (DTTMC) of 392 means that an investor who acquired a 5% position in the stock, assuming they wanted to be less than 25% of the average daily dollar volume, would require 78 days to trade out of their position. This is excellent liquidity by cannabis market standards.
- VOLUME SETTLES BACK TO A LOWER PACE IN THE HOLIDAY SHORTENED WEEK
-
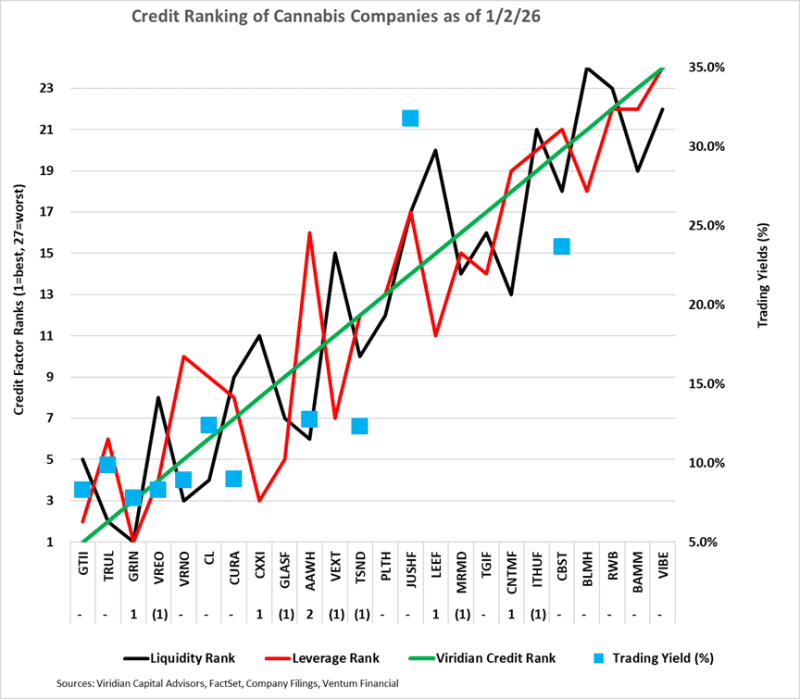
- GIVING CREDIT WHERE CREDIT IS DUE
-
-
- The Chart below displays our updated credit rankings for 25 U.S. cannabis companies as of December 26th, We have reduced our ranking set from 30 to 24 companies by eliminating AYR, CLS, FFNT, GRAM, SHWZ, and Tilt. Each of these companies is either in receivership (FFNT, GRAM), in restructuring discussions (AYR & SHWZ), or has out-of-date financials (AYR, FFNT, GRAM, SHWZ). Additionally, each trade is significantly out of the money, with stock price movements driven primarily by volatility rather than valuation.
- The blue squares show the offered-side trading yields for each Company.
- We find it curious that Cresco, TerrAscend, and Ascend are all trading within 25 basis points of each other. All three have refinanced their 2026 maturities, but we rank Cresco four notches better than Ascend and five notches better than TerrAscend.
-
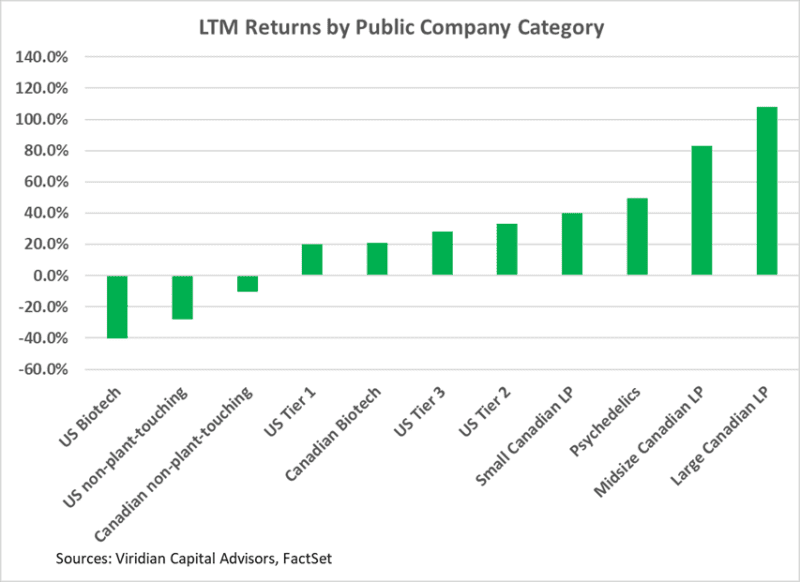
TRADING RETURNS FOR PUBLIC COMPANIES BY CATEGORY
-
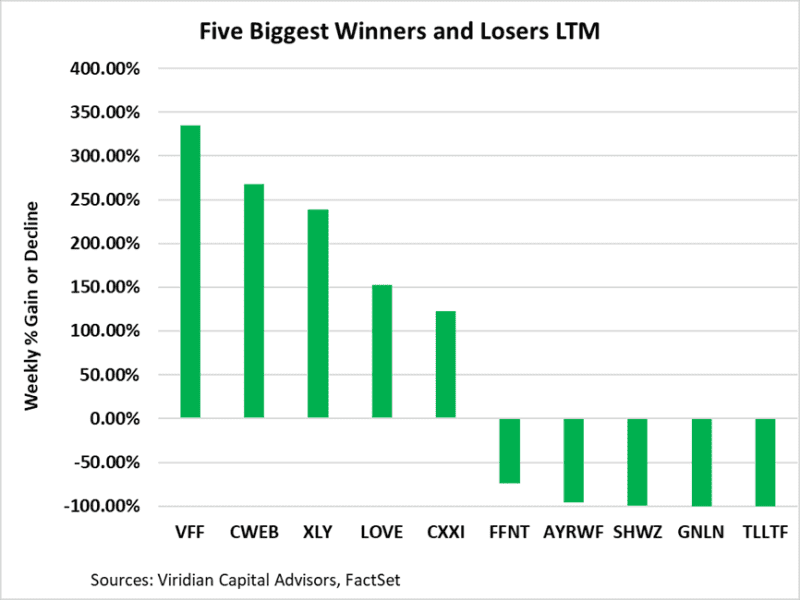
- S. MSOs, which have been showing LTM losses over the last few quarters, are now showing solid LTM gains following the latest rally.
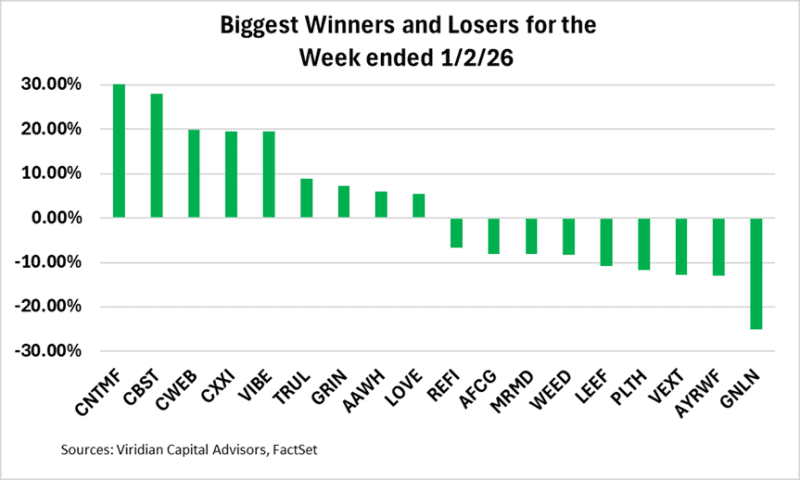
Best and Worst Performers for the week:
-
- The top gainer of the week was Fluent Corp, following the sale of its Pennsylvania operations and the use of proceeds to reduce debt.