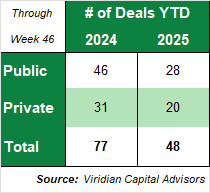
The Year-to-Date Charts for M&A include a detailed breakdown of M&A activity in the industry year to date, and as compared to prior year periods. This provides insight into M&A activity over time and the underlying trends driving M&A transactions. Charts include a breakdown between Buyer & Seller, Public & Private Companies and Industry Sector.
The Viridian Capital Chart of the Week highlights key investment, valuation, and M&A trends taken from that week’s Deal Tracker that we believe are impactful for investors, companies and acquirers.