OUR 9TH YEAR OF PROVIDING PROPRIETARY CAPITAL MARKETS INTELLIGENCE ON THE CANNABIS / HEMP / PSYCHEDELIC SECTORS
The Viridian Value Tracker is the most comprehensive valuation product in the industry.
-
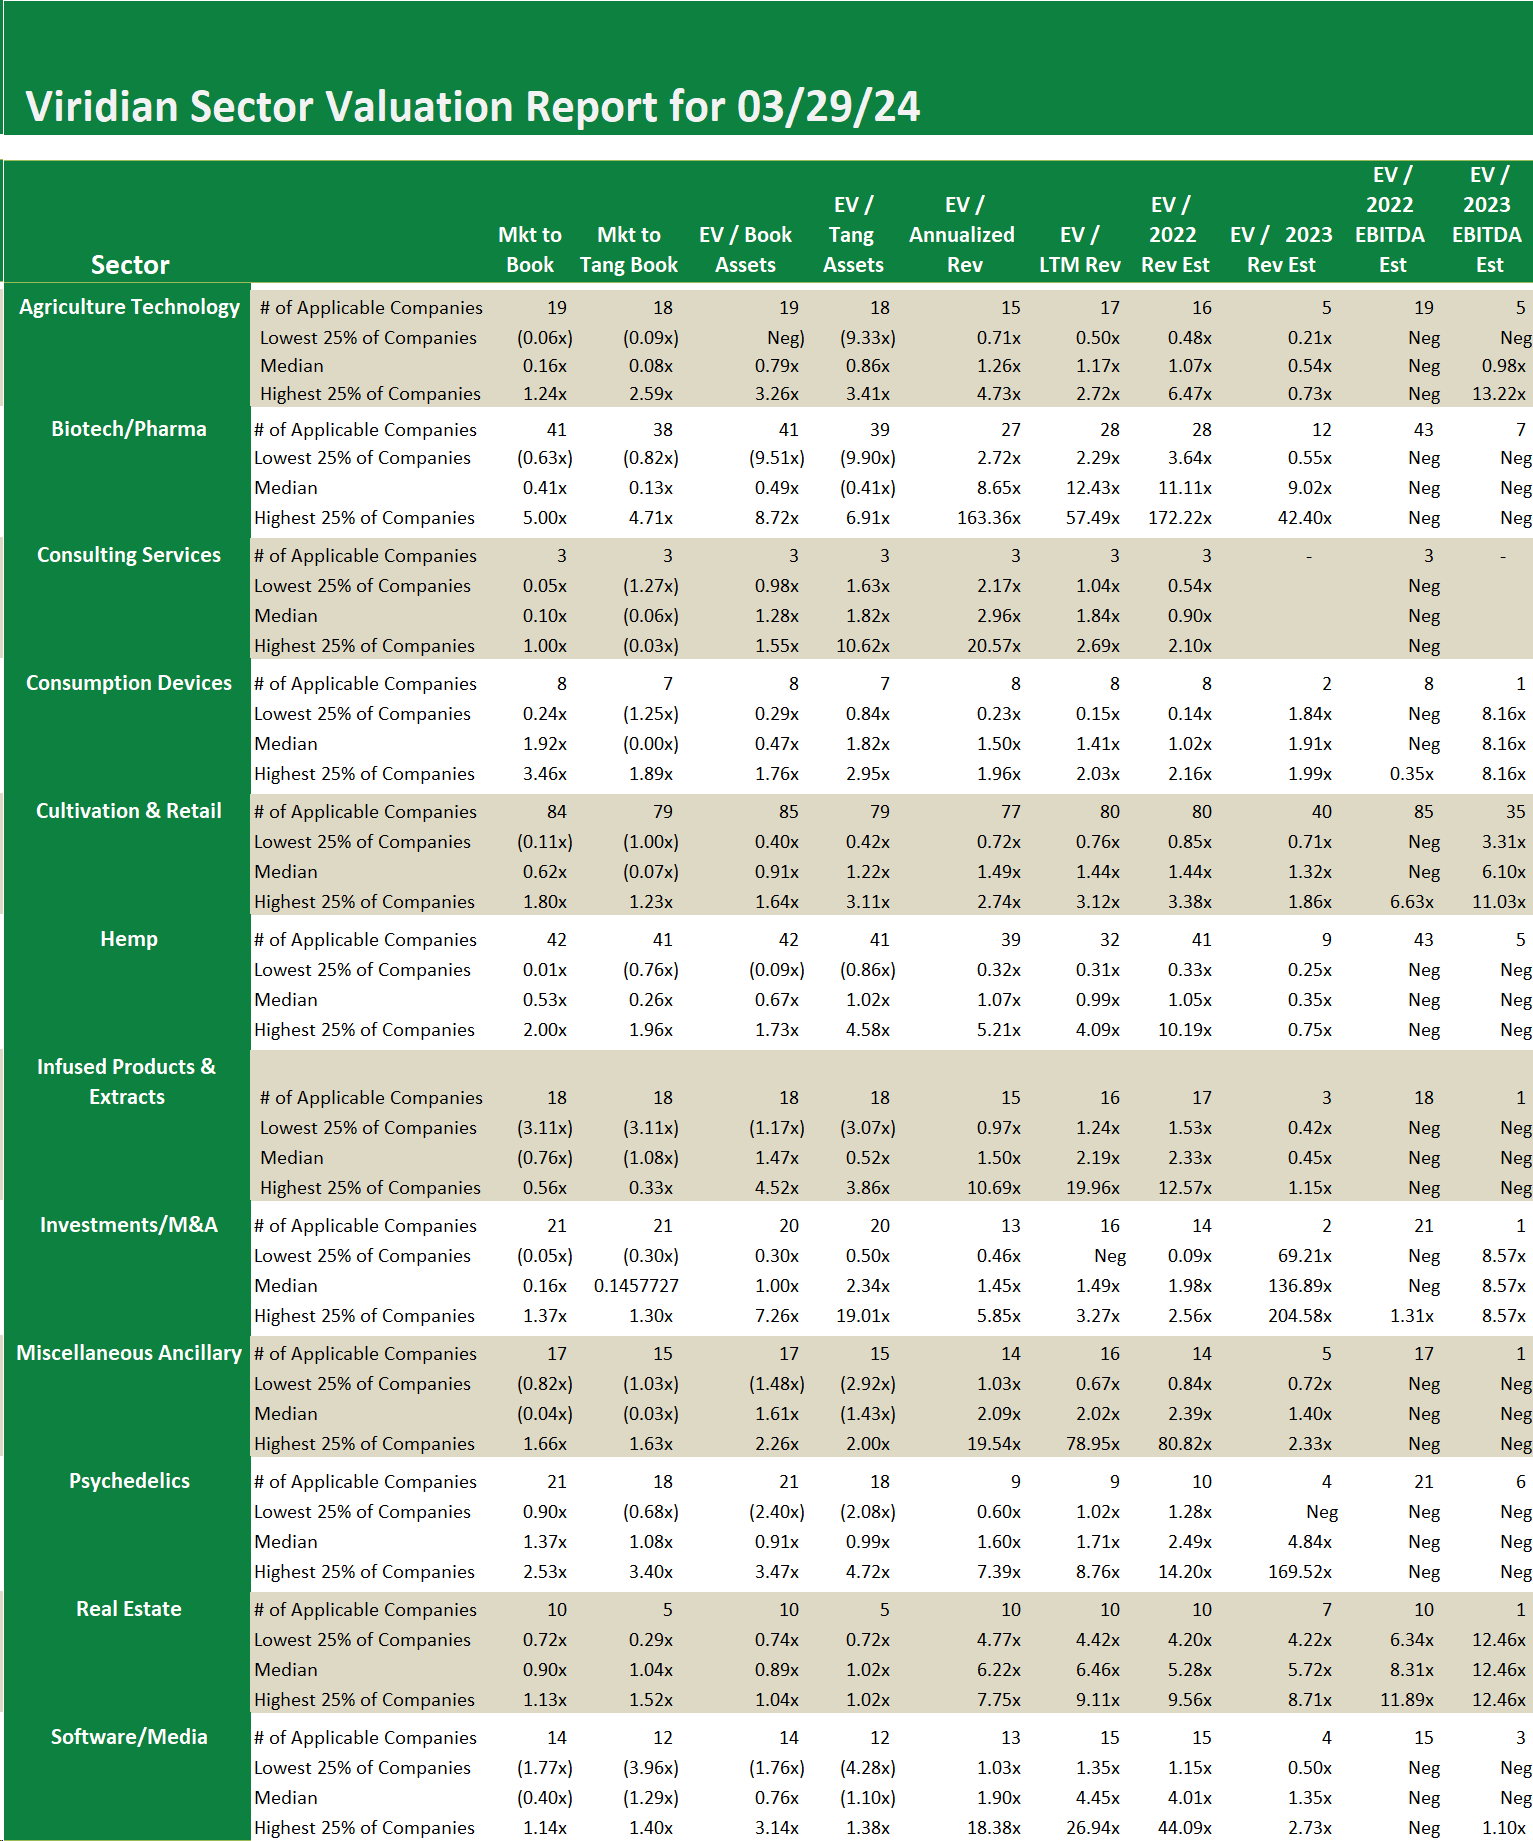
- A broad set of 12 valuation measures assures applicability, regardless of whether the company has analyst coverage or revenues. The typically presented EV/ Projected Revenues and EV/ Projected EBITDA are available for less than 1/3 of the cannabis companies we track.
- Most valuation studies present only the average valuation measures, while the Tracker goes one step further and shows the distribution of values (the quartiles, median, and dispersion) for each measure. This gives users a more complete view of how companies in the cohort group are valued.
- The sector valuation report now shows the median market to book for the 10 companies in the Real Estate sector is .9x. This seems surprising. Cannabis cultivator defaults seem to have plateaued, and a confirmation of Schedule 3 would boost the credit quality of the sector’s borrowers, so we would have anticipated a higher number. To investigate further, we drilled down into the data and found that five of the ten companies account for 99.5% of the market cap of the group.
- The graph below shows the market-to-book ratio of the five and the median is 1.0x. What accounts for the differences between the ratios? One hypothesis could be profitability. We might assume that more profitable companies would trade at higher market-to-book ratios. The blue line on the graph is a bespoke measure of profitability: annualized funds from operation to total assets. There is a correlation, but not a particularly strong one. One would get a similar picture by just looking at some measure of size. bigger is better.
- The impact of rescheduling on these players is interesting. On the one hand, we might expect two positive changes: 1) the financial flexibility of the portfolio companies should be better by whatever cash flow improvements are retained after eliminating 280e, and 2) a more vibrant capital market and more lenders could reduce debt rates, making the existing portfolios more valuable. The downside, however, is that better access to financing may make it more difficult to roll over existing loans or leases at the significant interest spreads the industry now enjoys. How will it all net out? We are anxious to see!