OUR 9TH YEAR OF PROVIDING PROPRIETARY CAPITAL MARKETS INTELLIGENCE ON THE CANNABIS / HEMP / PSYCHEDELIC SECTORS
The Viridian Value Tracker is the most comprehensive valuation product in the industry.
-
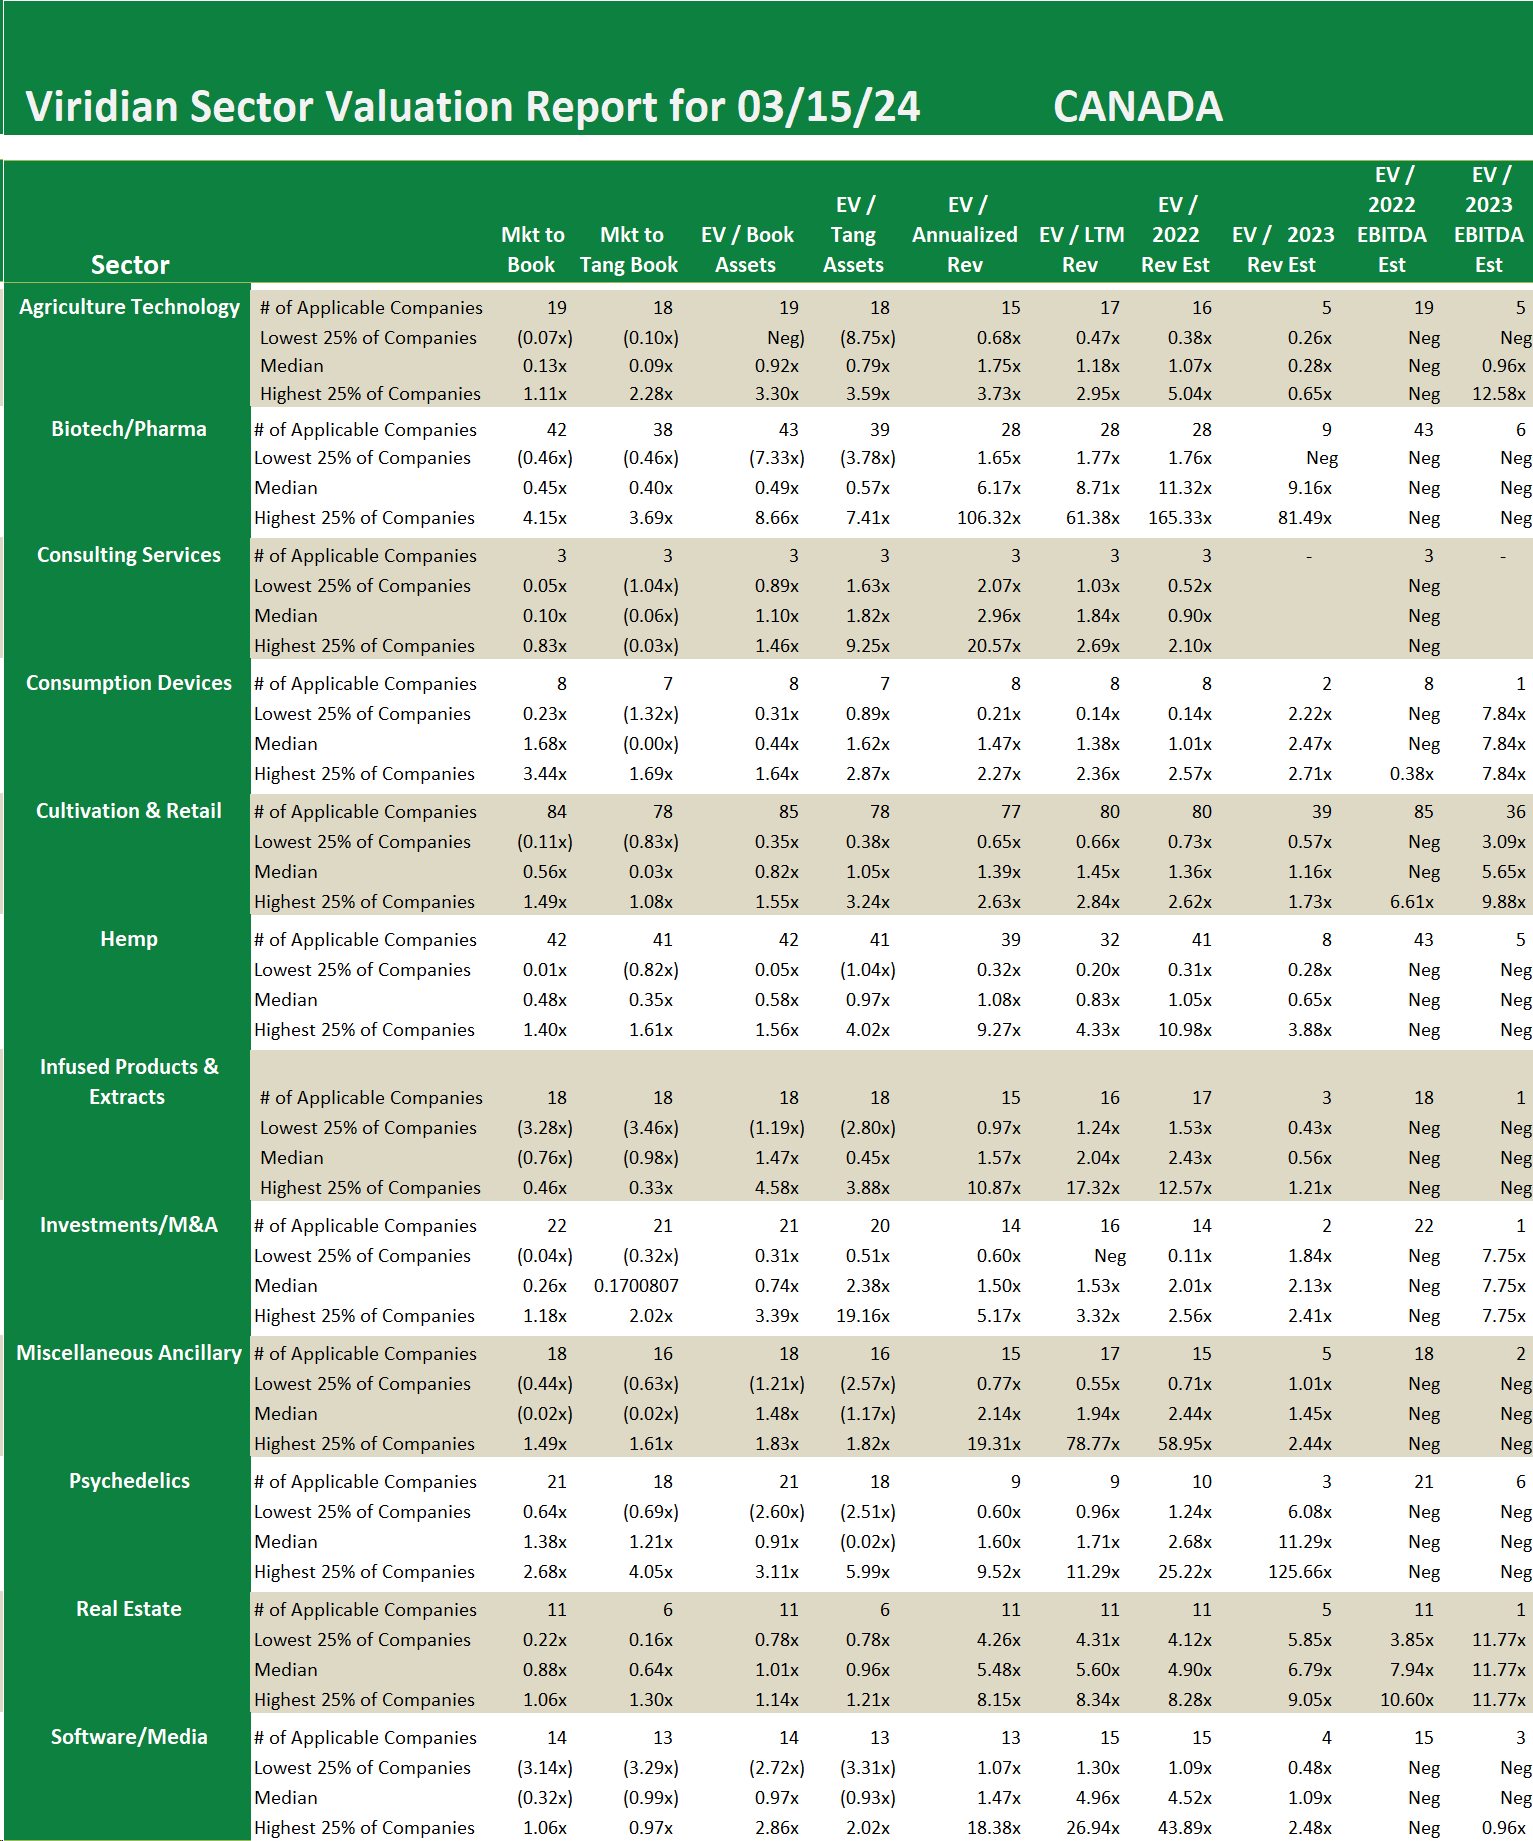
- A broad set of 12 valuation measures assures applicability, regardless of whether the company has analyst coverage or revenues. The typically presented EV/ Projected Revenues and EV/ Projected EBITDA are available for less than 1/3 of the cannabis companies we track.
- Most valuation studies present only the average valuation measures, while the Tracker goes one step further and shows the distribution of values (the quartiles, median, and dispersion) for each measure. This gives users a more complete view of how companies in the cohort group are valued.
Looking at the Cultivation and Retail sector, it is interesting to break out the valuation metrics of the U.S. compared to Canadian companies.
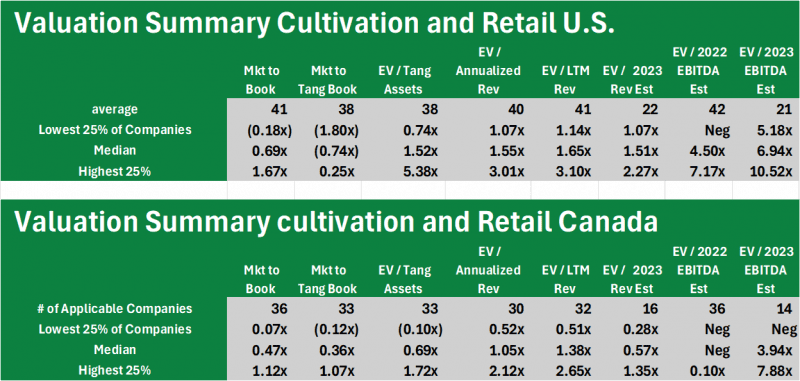
Interestingly, on a market-to-book basis, the U.S. companies are clearly superior; however, on a market-to-tangible-book basis, the U.S. companies have a negative median value. This indicates the presence of more goodwill and other intangible assets on the books of the U.S. companies, perhaps due to a more active M&A activity in the U.S. The U.S. is clearly substantially higher on all other valuation metrics, including EV/ Annualized Revenues at 1.55x vs 1.05x for the Canadians. The U.S. companies have a higher median EV/2023 EBITDA at 6.94x vs 3.94x for the Canadians. None of this is all that surprising, as we have been commenting on the financial metric superiority of the U.S. cannabis sector for quite some time. It is interesting to actually see the numbers, though.
Looking at the Cultivation and Retail sector, it is interesting to break out the valuation metrics of the U.S. compared to Canadian companies.
Interestingly, on a market-to-book basis, the U.S. companies are clearly superior; however, on a market-to-tangible-book basis, the U.S. companies have a negative median value. This indicates the presence of more goodwill and other intangible assets on the books of the U.S. companies, perhaps due to a more active M&A activity in the U.S. The U.S. is clearly substantially higher on all other valuation metrics, including EV/ Annualized Revenues at 1.55x vs 1.05x for the Canadians. The U.S. companies have a higher median EV/2023 EBITDA at 6.94x vs 3.94x for the Canadians. None of this is all that surprising, as we have been commenting on the financial metric superiority of the U.S. cannabis sector for quite some time. It is interesting to actually see the numbers, though.