OUR 9TH YEAR OF PROVIDING PROPRIETARY CAPITAL MARKETS INTELLIGENCE ON THE CANNABIS / HEMP / PSYCHEDELIC SECTORS

Quick
Links

Past Charts

Valuation Tracker By Industry Sector

Valuation Tracker By Sector

The Viridian Value Tracker is the most comprehensive valuation product in the industry.

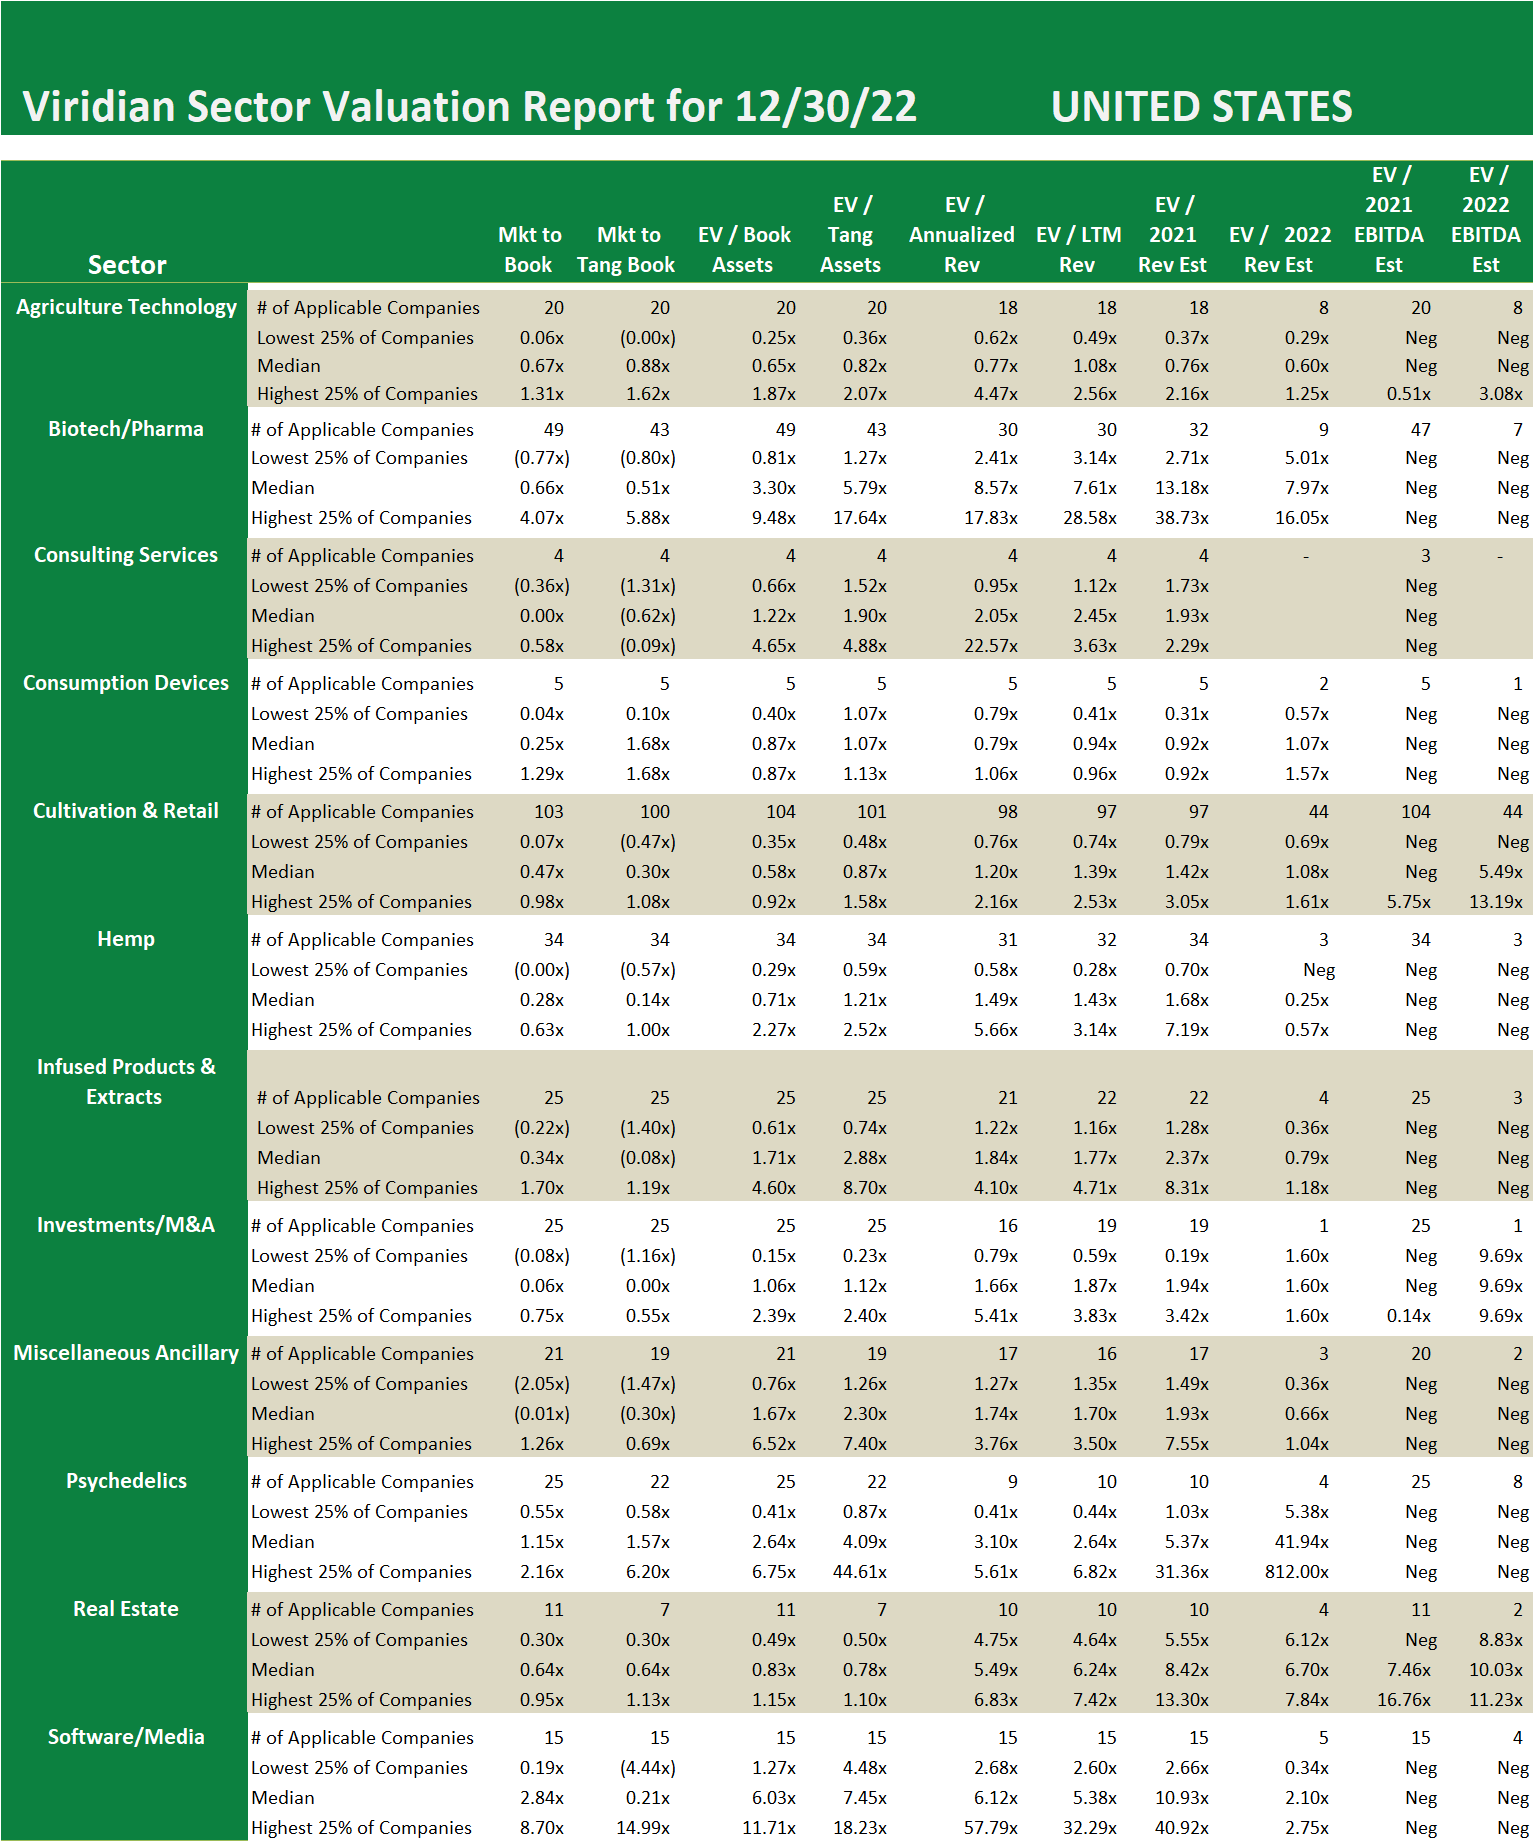
    • A broad set of 12 valuation measures assures applicability, regardless of whether the company has analyst coverage or revenues.  The typically presented EV/ Projected Revenues and EV/ Projected EBITDA are available for less than 1/3 of the cannabis companies we track.
    • Most valuation studies present only the average valuation measures, while the Tracker goes one step further and shows the distribution of values (the quartiles, median, and dispersion) for each measure. This gives users a more complete view of how companies in the cohort group are valued.

Week ended 12/30/2022

Our sector trackers include ratios applicable to value companies with no analyst coverage and the more typical EV/ Revenues and EV/ EBITDA measures. For each valuation measure, we present the values for the lowest 25% of companies, the median, and the highest 25%. This gives investors a better understanding of the spread of values than a simple average, often presented but frequently seriously flawed by outliers. One of the most interesting stats in the chart is the decline in valuation levels of Real Estate sector companies, which are lenders and providers of sale-leaseback transactions to the industry. The median market-to-book value for the 11 Real Estate sector companies in the Viridian Capital database was .64x at year-end 2022 compared to 1.43x at year-end 2021. Most of the assets of these companies are loans and leased assets, and it is surprising that these financial assets would be marked down so significantly by the market. Part of this is probably attributable to the impact of rising rates on fixed-rate loan assets. Still, part is also the market’s judgment that the credit quality of borrowers has deteriorated. 

This Chart is Only Available to Higher Tier Memberships

Please Purchase a Premium or Enterprise membership to see more.