OUR 9TH YEAR OF PROVIDING PROPRIETARY CAPITAL MARKETS INTELLIGENCE ON THE CANNABIS / HEMP / PSYCHEDELIC SECTORS
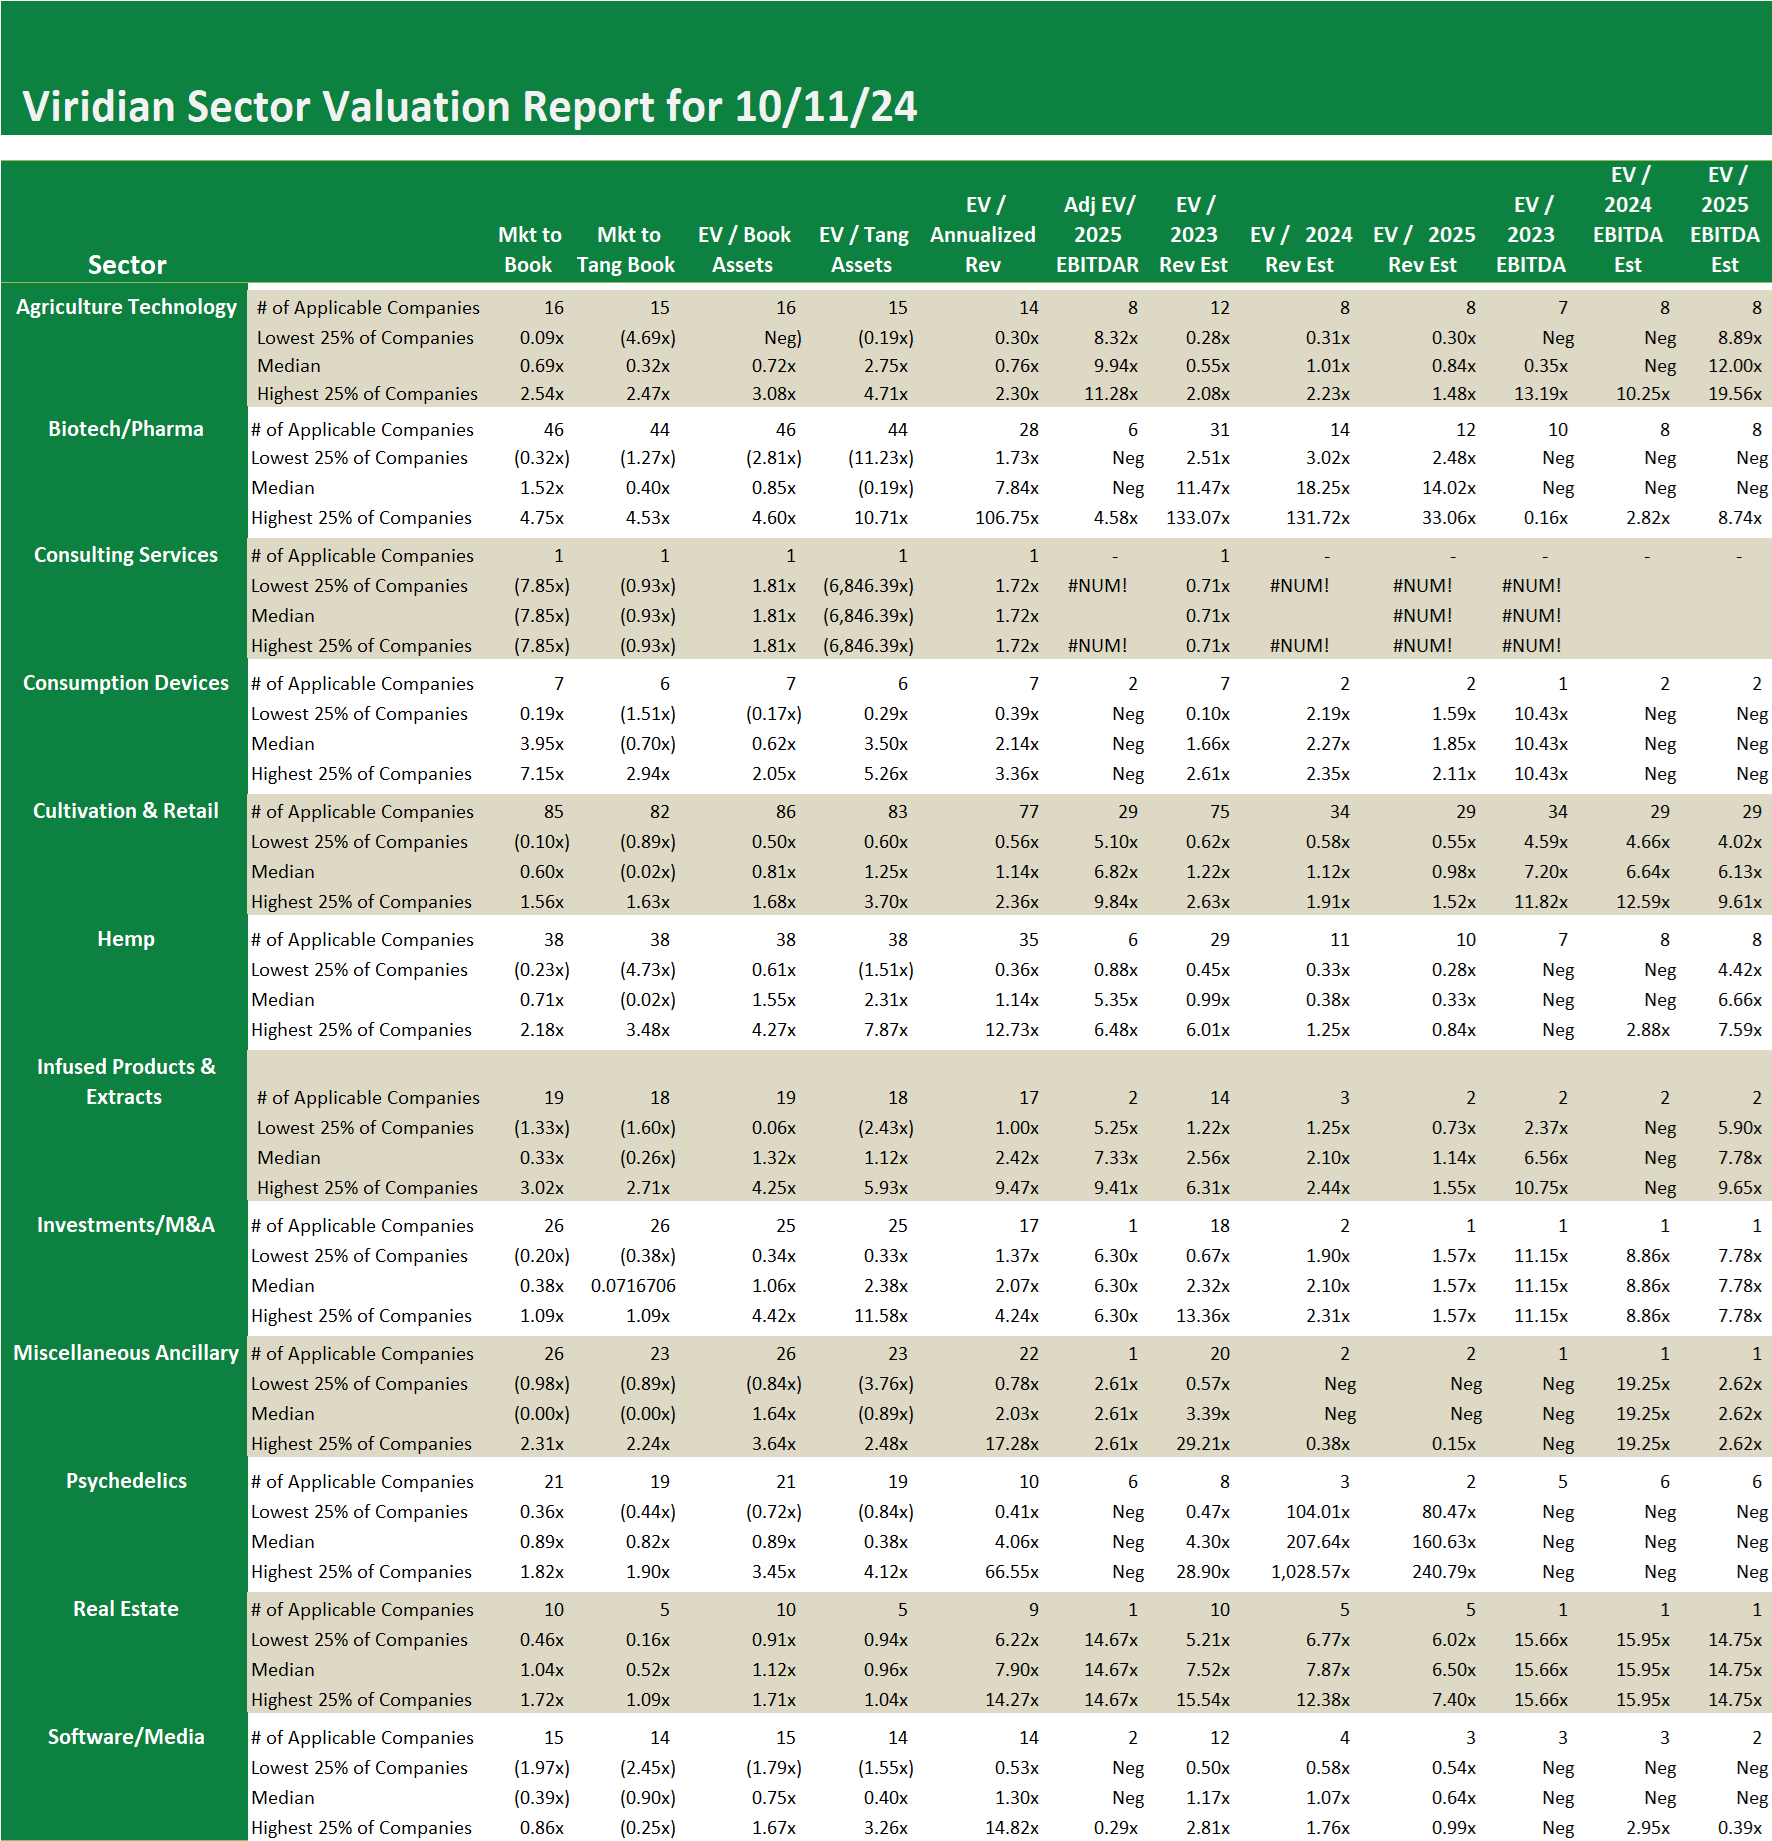
The Viridian Value Tracker is the most comprehensive valuation product in the industry.
-
- A broad set of 12 valuation measures assures applicability, regardless of whether the company has analyst coverage or revenues. The typically presented EV/ Projected Revenues and EV/ Projected EBITDA are available for less than 1/3 of the cannabis companies we track.
- Most valuation studies present only the average valuation measures, while the Tracker goes one step further and shows the distribution of values (the quartiles, median, and dispersion) for each measure. This gives users a more complete view of how companies in the cohort group are valued.
Weekly Sector Valuation Report – U.S. vs Canadian Valuations
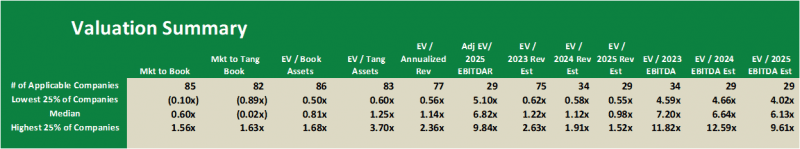
- The tables below break out the worldwide cultivation and retail sector into its U.S., Canadian, and Rest of the World segments.
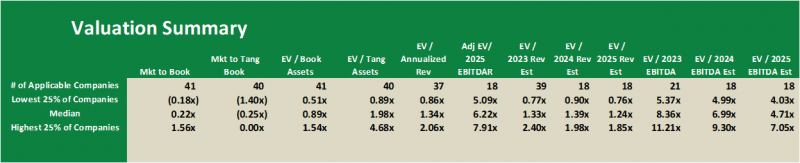
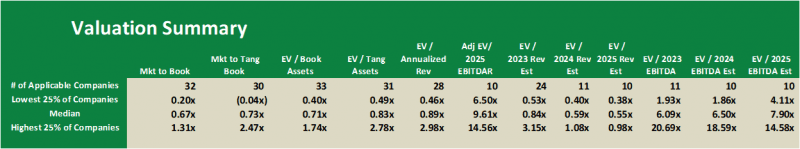
- The U.S. and Canadian competitors trade at median 2024 EBITDA multiples of 6.99x and 6.50x, respectively, which we find odd. The U.S. companies have to contend with 280e taxes while the Canadians do not. That should drive a valuation difference as $1 of U.S. EBITDA theoretically becomes less after-tax cash flow than $1 of Canadian EBITDA. Why don’t we see this gap? We believe one reason is the relatively more significant upside optionality from valuation catalysts like S3, Safer, etc.
U.S.
Canada
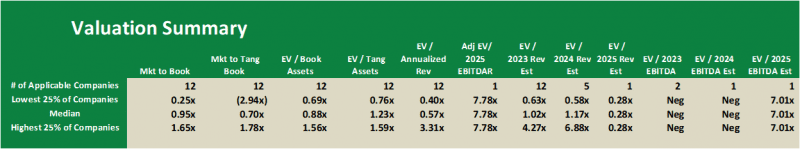
Rest of the World
Worldwide
Weekly Sector Valuation Report – U.S. vs Canadian Valuations
- The tables below break out the worldwide cultivation and retail sector into its U.S., Canadian, and Rest of the World segments.
- The U.S. and Canadian competitors trade at median 2024 EBITDA multiples of 6.99x and 6.50x, respectively, which we find odd. The U.S. companies have to contend with 280e taxes while the Canadians do not. That should drive a valuation difference as $1 of U.S. EBITDA theoretically becomes less after-tax cash flow than $1 of Canadian EBITDA. Why don’t we see this gap? We believe one reason is the relatively more significant upside optionality from valuation catalysts like S3, Safer, etc.
U.S.
Canada
Rest of the World
Worldwide