Viridian highlights a specific industry sector and provides a deep dive into valuation metrics and comparable company valuations for public companies operating in that sector. The Weekly Valuation Tracker provides proprietary, actionable valuation data.
Weekly Valuation Report – Valuation Metrics for MSOs with over $300M Market Cap
-
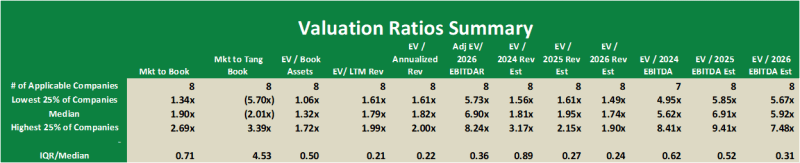
- The median EV/2026 EBITDA multiple for the eight MSOs with over $300M market cap is now 5.92x, while the EV/2026 Revenues multiple is 1.74x. The IQR/median values for these two measures are significantly lower than those for 2025, indicating a tighter grouping around the median.
- The median Adj. EV/2026 EBITDAR for the group is 6.90x, and we believe this is a truer measure of how the market is valuing these companies. Adjusted EV includes both operating leases and all tax liabilities in excess of 90 days of tax expense. It is unclear how these tax liabilities will be settled in a post-280E environment, but investors and lenders would be remiss not to take them into account.
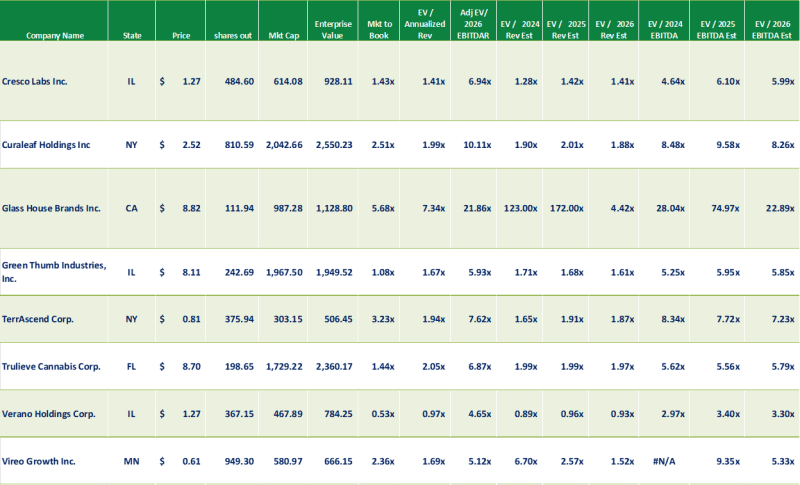
- It is interesting to look at the extreme values. On the low end, Verano is the only group member that currently trades at less than 1x market/book. Verano’s EV/EBITDA multiples are also significantly lower than the rest of the group. Why is this? Verano does not have lower EBITDA margins than the group; in fact, the company with the lowest consensus EBITDA margin, Glass House, has the highest multiples by a wide margin. Another hypothesis is that unresolved debt maturities are weighing on valuation. But this doesn’t explain why Curaleaf, with even larger 2026 maturities, trades near the top of the range.
- On the high end of the range, Glass House trades at nearly 23x 2026 EBITDA. Part of this outsized multiple undoubtedly relates to the company’s recent underperformance. We have always believed that every portfolio should include at least some Glass House, as the company represents the most reasonable hedge against one of the largest risks facing MSOs in the long run – interstate commerce. But at current valuations, we are unsure how to be comfortable.
The Viridian Value Tracker is the most comprehensive valuation product in the industry.
-
- A broad set of 12 valuation measures assures applicability, regardless of whether the company has analyst coverage or revenues. The typically presented EV/ Projected Revenues and EV/ Projected EBITDA are available for less than 1/3 of the cannabis companies we track.
- Most valuation studies present only the average valuation measures, while the Tracker goes one step further and shows the distribution of values (the quartiles, median, and dispersion) for each measure. This gives users a more complete view of how companies in the cohort group are valued.
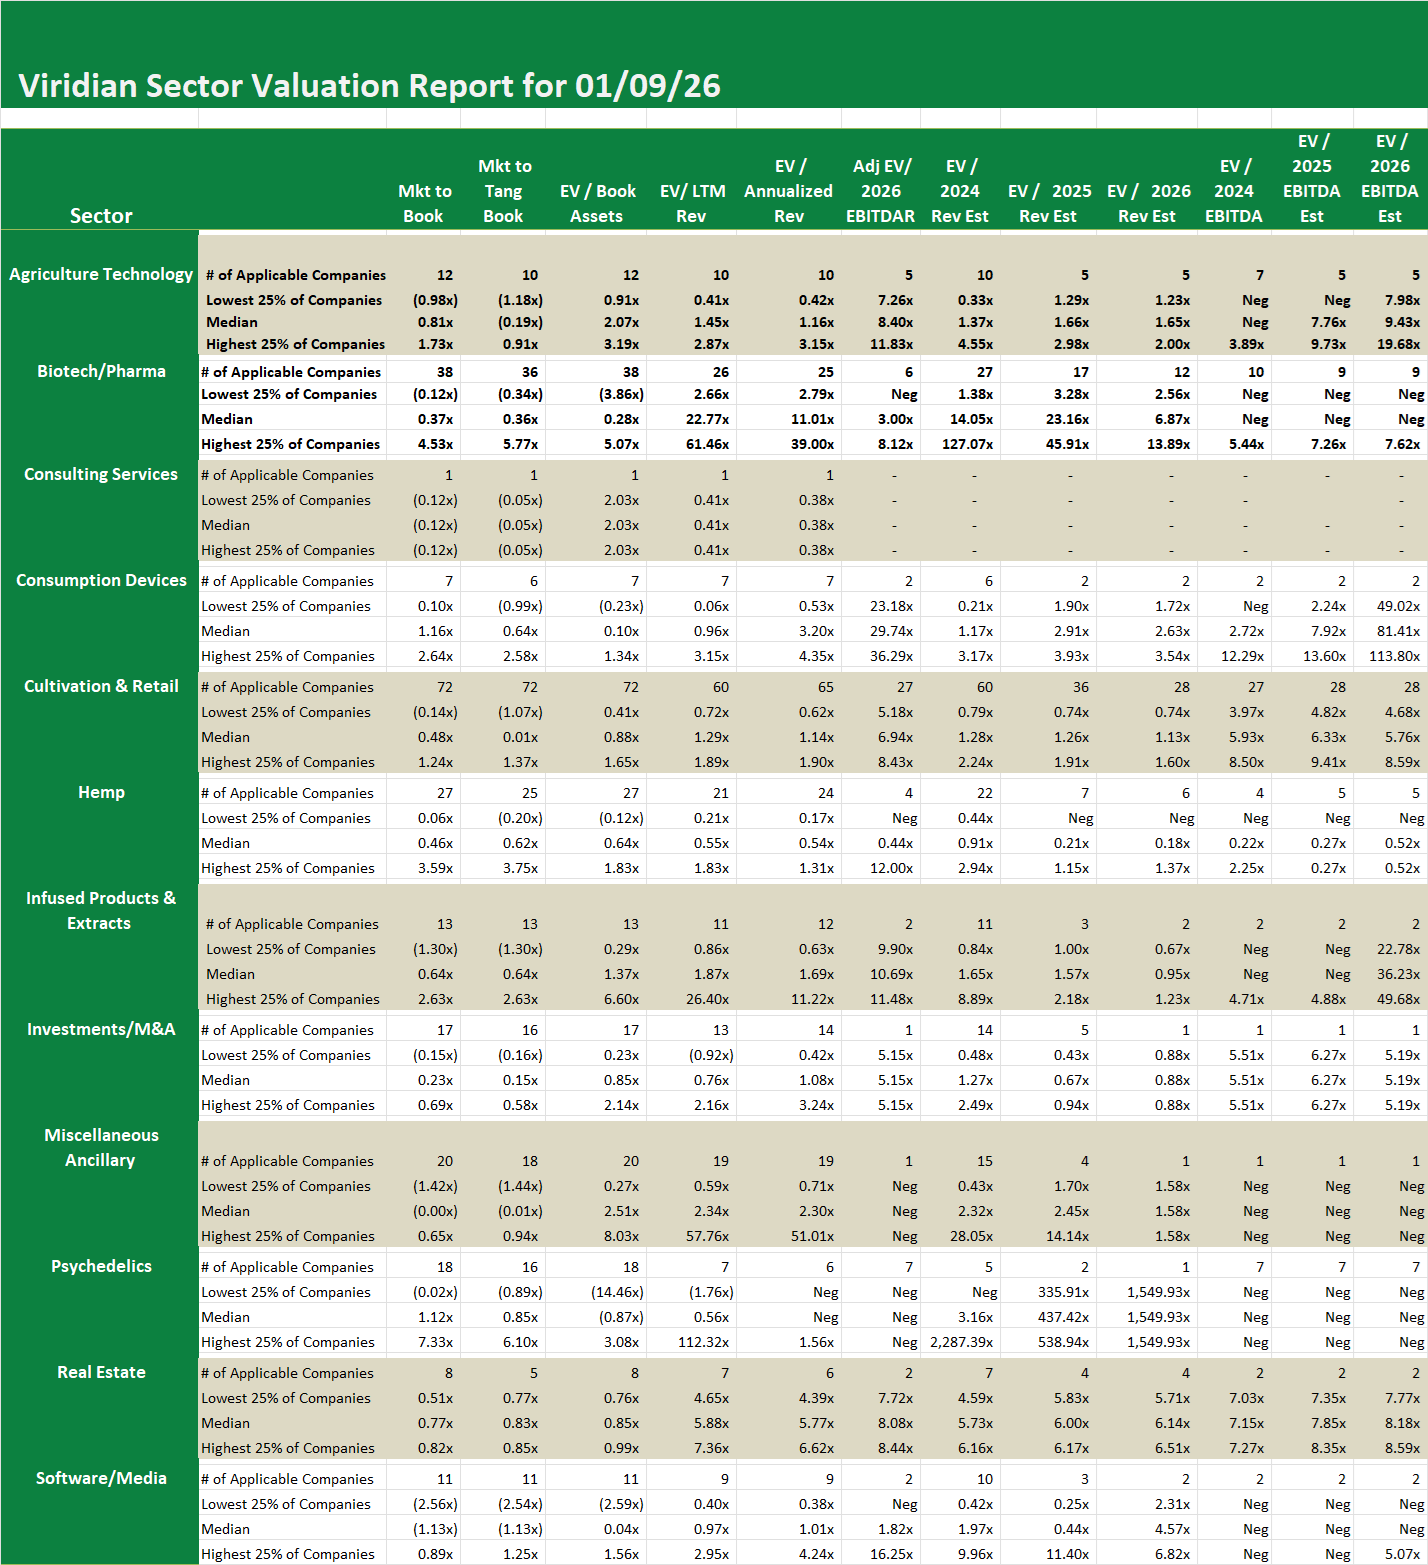
Sector Valuation Report – Biotech/Pharma sector as of 1/9/26
-
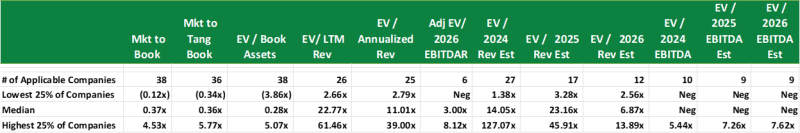
- The 26 Biotech sector companies with revenues now trade at a median EV/2026 revenues of 11.01x, while the 12 with analyst coverage trade at a lower median of 6.87x.
Sector Valuation Report – Biotech/Pharma sector as of 1/9/26
-
- The 26 Biotech sector companies with revenues now trade at a median EV/2026 revenues of 11.01x, while the 12 with analyst coverage trade at a lower median of 6.87x.