OUR 9TH YEAR OF PROVIDING PROPRIETARY CAPITAL MARKETS INTELLIGENCE ON THE CANNABIS / HEMP / PSYCHEDELIC SECTORS
Each week, Viridian publishes insights and analysis on completed M&A transactions in the prior week. Our analysis includes:
-
- M&A Market Commentary
- Public and Private Companies
- Buyers & Sellers
- YTD M&A Analysis
- M&A by Industry Sector
- Deal Structure and Valuation Analysis
- Pending Deal Risk Arb Analysis
- Valuation Gap Analysis
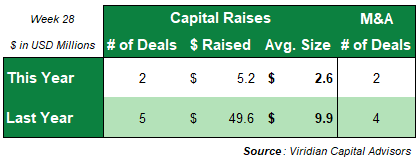
- Two M&A transactions closed this week for disclosed transaction value of $49.25M compared to four transactions for $157.3M in the prior year.
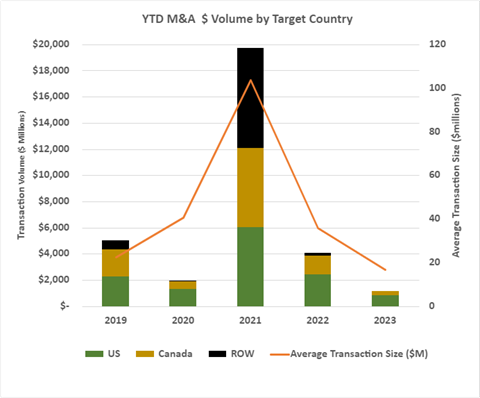
- Sixty-eight transactions totaling $1.18B have closed YTD, compared to one hundred and fourteen transactions for $08B last year.
- The 2023 YTD average transaction size of $17.32M is the lowest in recent years.
-
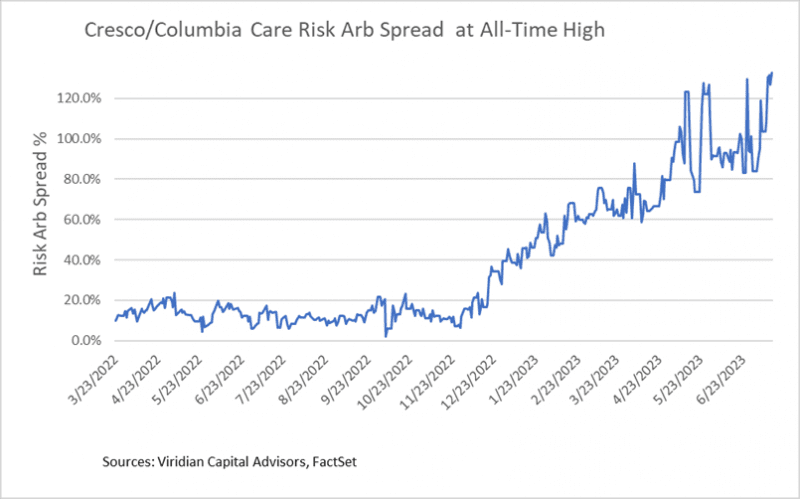
- The Cresco/Columbia deal spread increased to an all-time high of 132.6% on 7/14/23. Although both parties said they were “working amicably with respect to next steps,” the arb spread indicates the market does not believe this deal will close as presently structured. The spread may also relate to the relative credit qualities of the two companies. Columbia Care “needs” the deal more than Columbia does, although both companies need the asset sale proceeds to reduce debt to long-term sustainable levels of under 3x EBITDA.

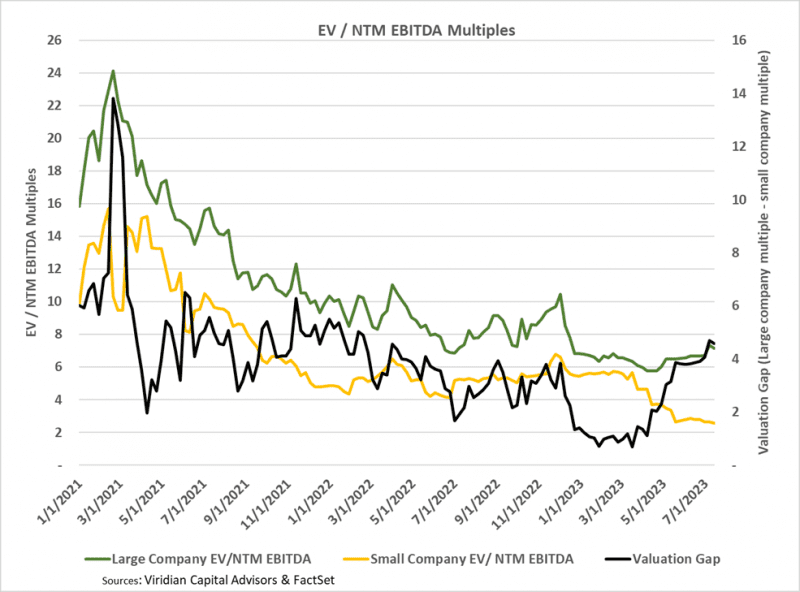
- The valuation gap narrowed by 10bp to 4.59 on 7/14/23, still close to the highest the measure has been since February 2022. The valuation gap is the difference between the EV/NTM EBITDA multiple for the largest MSOs and the multiple for the less than $300M market cap group, which are their primary targets.
- This measure has been a significant driver of M&A activity since a larger gap creates an opportunity for more accretive transactions. The gap tends to increase in improving markets while declining in retreating markets to the greater trading liquidity of the larger companies. We believe the current gap is still understated by the massive illiquidity of cannabis stocks which may not be accurate indicators of the prices at which the entire companies would trade.