OUR 9TH YEAR OF PROVIDING PROPRIETARY CAPITAL MARKETS INTELLIGENCE ON THE CANNABIS / HEMP / PSYCHEDELIC SECTORS
Each week, Viridian publishes insights and analysis on completed M&A transactions in the prior week. Our analysis includes:
-
- M&A Market Commentary
- Public and Private Companies
- Buyers & Sellers
- YTD M&A Analysis
- M&A by Industry Sector
- Deal Structure and Valuation Analysis
- Pending Deal Risk Arb Analysis
- Valuation Gap Analysis
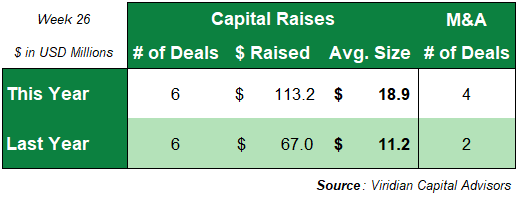
- Four M&A transactions closed this week for disclosed transaction value of $28.9M compared to two transactions for $57.7MM in the prior year.
- Four M&A transactions closed this week for disclosed transaction value of $28.9M compared to two transactions for $57.7MM in the prior year.
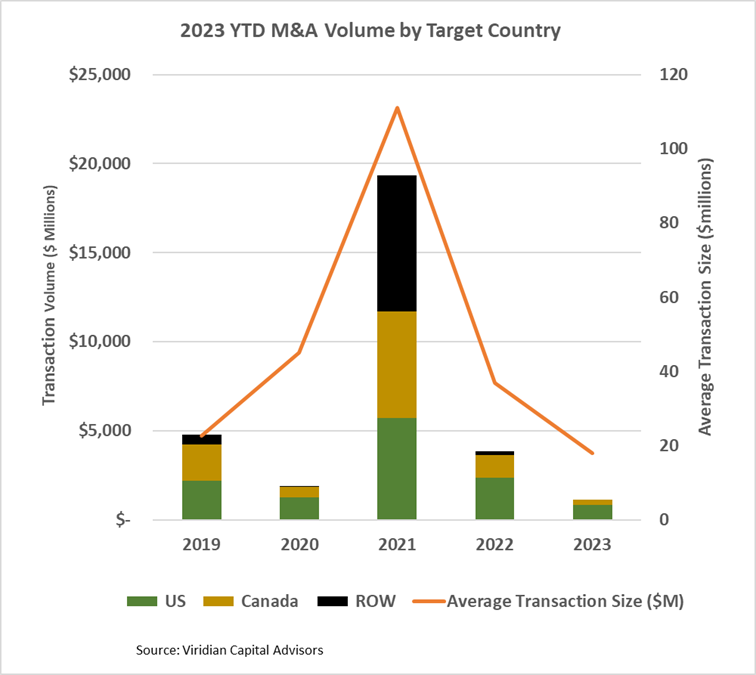
- Sixty-three transactions totaling $1.13B have closed YTD, compared to one hundred and three transactions for $87B last year.
-
- The Cresco/Columbia deal spread increased by 100bp to 84.1% on 6/30/23. In a 6/30/23 press release, Cresco said the parties could not complete the divestitures necessary to obtain regulatory clearances to close the transaction but were “working amicably with respect to next steps.” The arb spread has come down from its peak of over 120% but at 84.1%, still indicates the market does not believe this deal will close as presently structured. The spread may also relate to the relative credit qualities of the two companies. Columbia Care “needs” the deal more than Columbia does, although both companies need the asset sale proceeds to reduce debt to long-term sustainable levels of under 3x EBITDA. A collapse of this headline transaction would be negative for the whole industry.


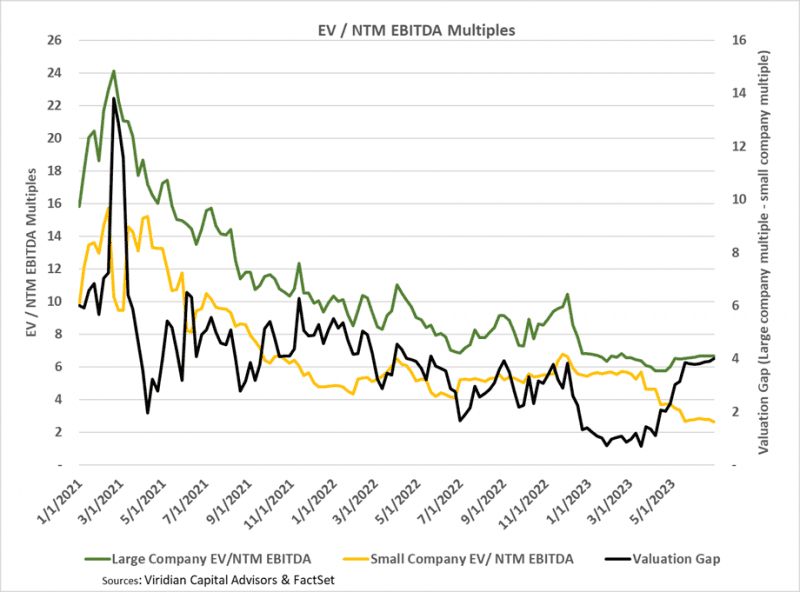
- The valuation gap widened by 13bp to 4.03 on 6/30/23, the first time the measure has topped 4.0 since 5/20/22. The valuation gap is the difference between the EV/NTM EBITDA multiple for the largest MSOs and the multiple for the less than $300M market cap group, which are their primary targets.
- This measure has been a significant driver of M&A activity since a larger gap creates an opportunity for more accretive transactions. The gap tends to increase in improving markets while declining in retreating markets to the greater trading liquidity of the larger companies. We believe the current gap is still understated by the massive illiquidity of cannabis stocks which may not be accurate indicators of the prices at which the entire companies would trade.