OUR 9TH YEAR OF PROVIDING PROPRIETARY CAPITAL MARKETS INTELLIGENCE ON THE CANNABIS / HEMP / PSYCHEDELIC SECTORS
Each week, Viridian publishes insights and analysis on completed M&A transactions in the prior week. Our analysis includes:
-
- M&A Market Commentary
- Public and Private Companies
- Buyers & Sellers
- YTD M&A Analysis
- M&A by Industry Sector
- Deal Structure and Valuation Analysis
- Pending Deal Risk Arb Analysis
- Valuation Gap Analysis
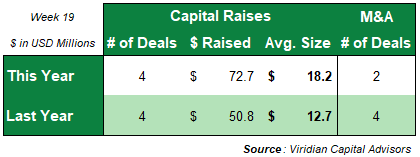
- Two M&A transactions closed this week with transaction values of $7.5M, compared to four transactions for $101.32M in the prior year.
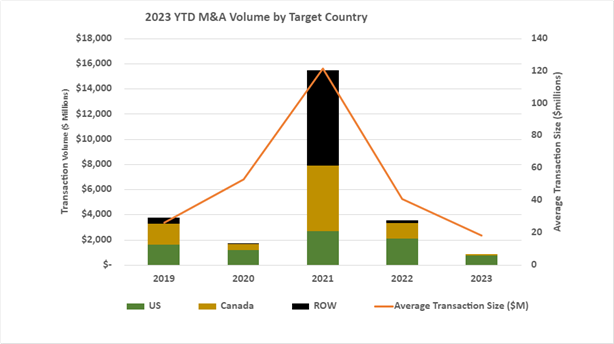
- Forty-seven transactions totaling $867.3M have closed YTD, compared to eighty-seven transactions for $3,553.0M last year.
- The 2023 YTD average transaction size of $18.45M is the lowest in recent years.
-
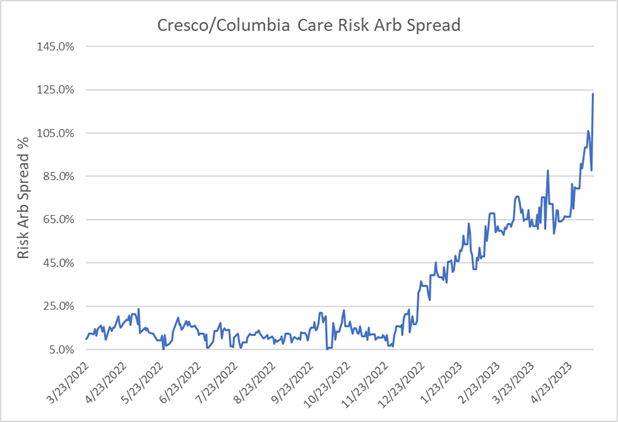
- The Cresco/Columbia deal spread widened by 2480 bp to 123.2% on 5/12/23, a second consecutive record. A spread this wide says that the market does not believe that this deal will close as presently structured. Numerous reasons include the constrained capital markets making required divestitures in Ohio and Florida more challenging. The spread may also relate to the relative credit qualities of the two companies. Columbia Care “needs” the deal to close as its long-term liquidity profile is challenging as a standalone, whereas Cresco is somewhat better positioned. Still, trading in a cluster of companies at around .9x 2023 revenues, Columbia seems like an intriguing bet – a bonanza if the merger closes and a contained downside if it doesn’t.
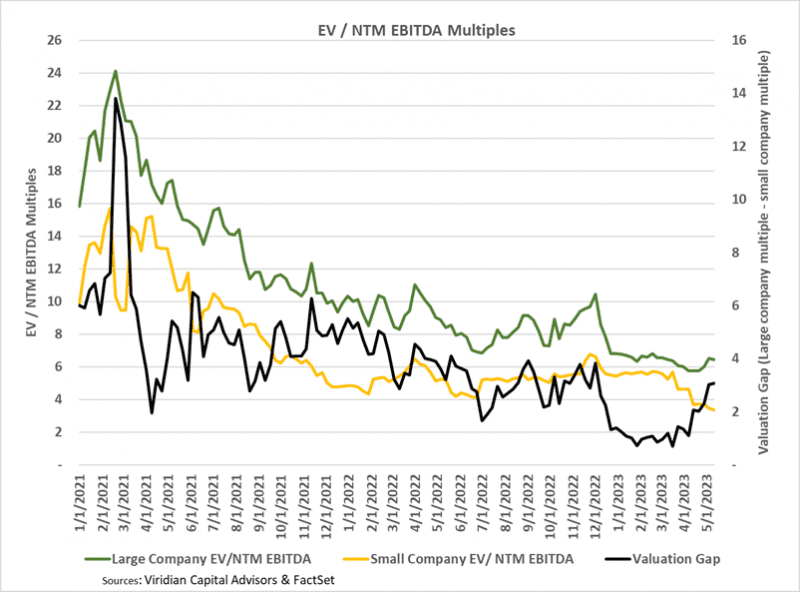
- The valuation gap widened to 3.08 on 5/12/23, rising above its 52-week moving average of 2.36 for the third consecutive week in 2023. The valuation gap is the difference between the EV/NTM EBITDA multiple for the largest MSOs and the multiple for the less than $300M market cap group, which are their primary targets.
- This measure has been a significant driver of M&A activity since a larger gap creates an opportunity for more accretive transactions. The gap tends to increase in improving markets while declining in retreating markets to the greater trading liquidity of the larger companies. We believe the current gap is still understated by the massive illiquidity of cannabis stocks which may not be accurate indicators of the prices at which the entire companies would trade.