OUR 9TH YEAR OF PROVIDING PROPRIETARY CAPITAL MARKETS INTELLIGENCE ON THE CANNABIS / HEMP / PSYCHEDELIC SECTORS
Each week, Viridian publishes insights and analysis on completed M&A transactions in the prior week. Our analysis includes:
-
- M&A Market Commentary
- Public and Private Companies
- Buyers & Sellers
- YTD M&A Analysis
- M&A by Industry Sector
- Deal Structure and Valuation Analysis
- Pending Deal Risk Arb Analysis
- Valuation Gap Analysis
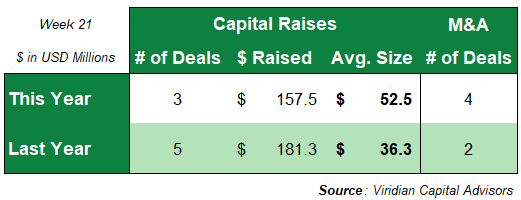
- Four M&A transactions closed this week for $34.54M, compared to two transactions for $26.78M in the prior year.
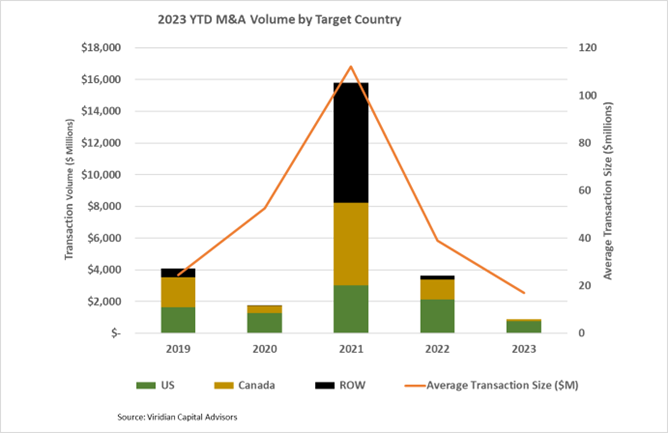
- Fifty-three transactions totaling $904.9M have closed YTD, compared to ninety-three transactions for $3,622.1M last year.
- The 2023 YTD average transaction size of $17.0M is the lowest in recent years.
-
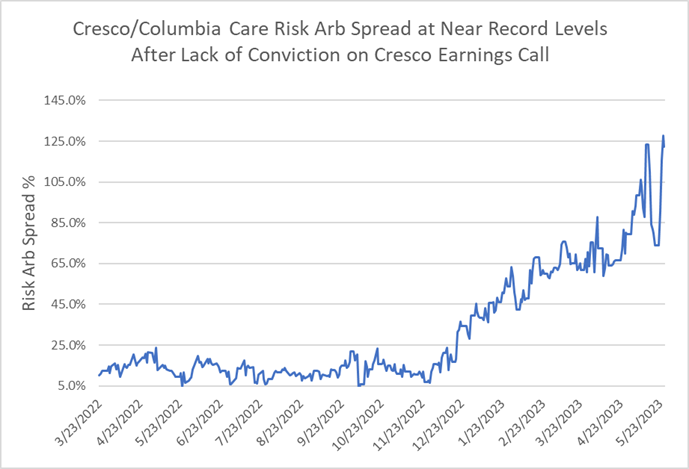
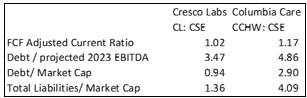
- The Cresco/Columbia deal spread widened by 4830bp to 122.2% on 5/26/23 after the management suggested that unless divestiture proceeds are above critical levels, the deal may not “make sense.” This is the most explicit suggestion by the company to date that the transaction may be in trouble. Of course, we have been saying that the arb spread indicates the market does not believe this deal will close as presently structured. The spread may also relate to the relative credit qualities of the two companies. Columbia Care “needs” the deal to close as its long-term liquidity profile is challenging as a standalone, whereas Cresco is somewhat better positioned. Columbia plans to achieve positive operating cash flow in 2023 through better working capital management and additional cost savings. A collapse of this headline transaction would be negative for the whole industry.
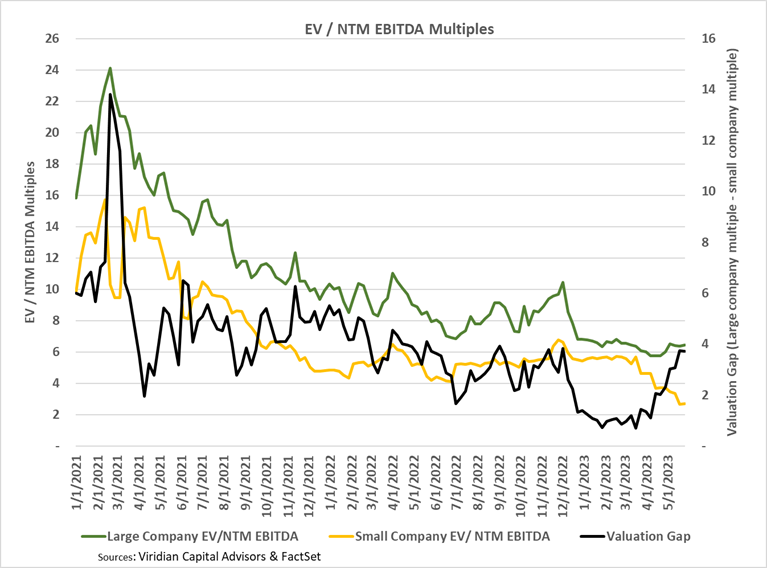
- The valuation gap held nearly constant at 3.72 on 5/26/23, one bp shy of the highest reading since 12/2/22. The valuation gap is the difference between the EV/NTM EBITDA multiple for the largest MSOs and the multiple for the less than $300M market cap group, which are their primary targets.
- This measure has been a significant driver of M&A activity since a larger gap creates an opportunity for more accretive transactions. The gap tends to increase in improving markets while declining in retreating markets to the greater trading liquidity of the larger companies. We believe the current gap is still understated by the massive illiquidity of cannabis stocks which may not be accurate indicators of the prices at which the entire companies would trade.