OUR 9TH YEAR OF PROVIDING PROPRIETARY CAPITAL MARKETS INTELLIGENCE ON THE CANNABIS / HEMP / PSYCHEDELIC SECTORS
Each week, Viridian publishes insights and analysis on completed M&A transactions in the prior week. Our analysis includes:
-
- M&A Market Commentary
- Public and Private Companies
- Buyers & Sellers
- YTD M&A Analysis
- M&A by Industry Sector
- Deal Structure and Valuation Analysis
- Pending Deal Risk Arb Analysis
- Valuation Gap Analysis
- Three M&A transactions closed this week for $73.8M compared to three transactions for $474.0M in the prior year.
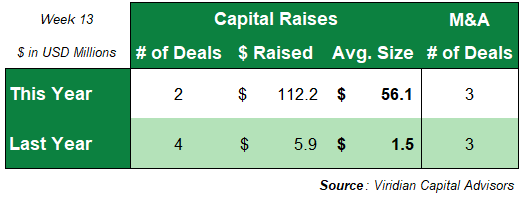
- Thirty-five transactions totaling $815.6M have closed YTD, compared to sixty transactions for $2,506.03M last year.
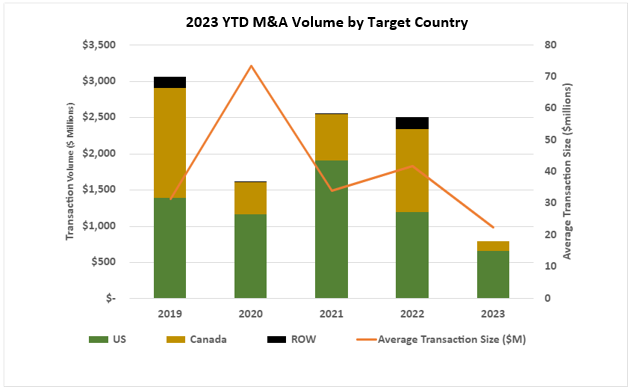
- The 2023 YTD average transaction size of $230M is the lowest in recent years.
-
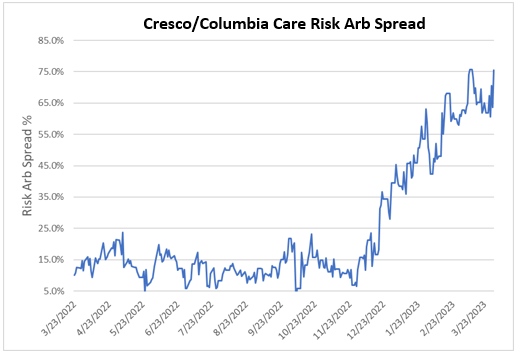
- The Cresco/Columbia deal spread widened by 1360 bp to 75.5% on 3/31/23, returning to near-record levels. A 75.5% arb spread screams skepticism that the agreement will survive as presently structured because that return over a three-month horizon seems too good to be true. If you think this deal will close, as does one noted sell-side analyst we respect, then why wouldn’t you try to establish the arb position of being long Columbia and short Cresco?
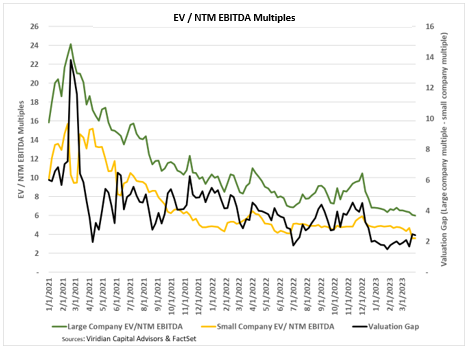
- The valuation gap widened to 2.41 on 3/31/23, climbing back towards its 52-week average of 3.04. The valuation gap is the difference between the EV/NTM EBITDA multiple for the largest MSOs and the multiple for the less than $300M market cap group, which are their primary targets.
- This measure has been a significant driver of M&A activity since a larger gap creates an opportunity for more accretive transactions. The gap tends to increase in improving markets while declining in retreating markets to the greater trading liquidity of the larger companies. We believe the current gap is understated by the massive illiquidity of cannabis stocks which may not be accurate indicators of the prices at which the entire companies would trade.