OUR 9TH YEAR OF PROVIDING PROPRIETARY CAPITAL MARKETS INTELLIGENCE ON THE CANNABIS / HEMP / PSYCHEDELIC SECTORS
Each week, Viridian publishes insights and analysis on completed M&A transactions in the prior week. Our analysis includes:
-
- M&A Market Commentary
- Public and Private Companies
- Buyers & Sellers
- YTD M&A Analysis
- M&A by Industry Sector
- Deal Structure and Valuation Analysis
- Pending Deal Risk Arb Analysis
- Valuation Gap Analysis
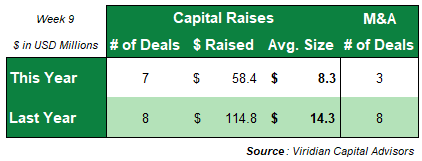
- Three M&A transactions closed this week for 533.74M compared to eight transactions for $310.73M in the prior year.
- Three M&A transactions closed this week for 533.74M compared to eight transactions for $310.73M in the prior year.
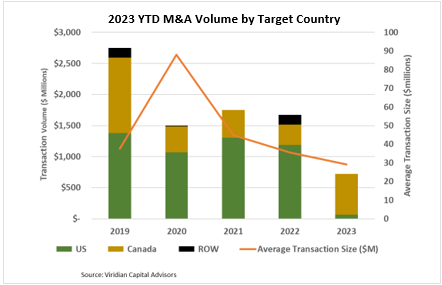
- Twenty-five transactions totaling $728.81M have closed YTD, compared to forty-seven transactions for $1,669.04M last year.
- The 2023 YTD average transaction size of $29.15M and the 33% of total consideration accounted for by the U.S. are both the lowest in recent years.
-
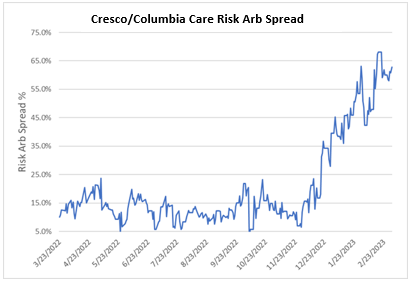
- The Cresco/Columbia deal spread widened by 280bp to 62.8% on 3/3/23, following an announcement of a three-month delay in expected closing. Still, a 62.8% arb spread screams skepticism that the deal will survive as presently structured. An unannualized rate of return of over 60% for a four-month investment seems too good to be true. If you think this deal will close, as does one noted sell-side analyst we respect, then why wouldn’t you try to establish the arb position of being long Columbia and short Cresco?
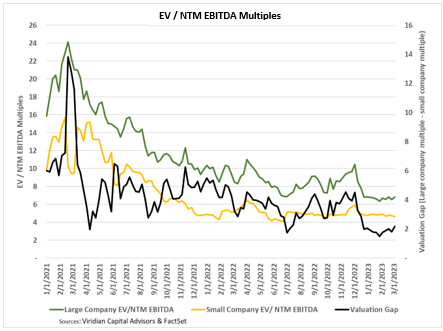
- The valuation gap widened to 2.19 on 3/3/23 but remained close to the lowest measure since we began tracking this measure. The valuation gap is the difference between the EV/NTM EBITDA multiple for the largest MSOs and the multiple for the less than $300M market cap group, which are their primary targets.
- This measure has been a significant driver of M&A activity since a larger gap creates an opportunity for more accretive transactions. The gap tends to increase in improving markets while declining in retreating markets to the greater trading liquidity of the larger companies. We believe the current gap is understated as it is skewed by the massive illiquidity of cannabis stocks which may not be accurate indicators of the prices at which the entire companies would trade.