OUR 9TH YEAR OF PROVIDING PROPRIETARY CAPITAL MARKETS INTELLIGENCE ON THE CANNABIS / HEMP / PSYCHEDELIC SECTORS
Each week, Viridian publishes insights and analysis on completed M&A transactions in the prior week. Our analysis includes:
-
- M&A Market Commentary
- Public and Private Companies
- Buyers & Sellers
- YTD M&A Analysis
- M&A by Industry Sector
- Deal Structure and Valuation Analysis
- Pending Deal Risk Arb Analysis
- Valuation Gap Analysis
- Two M&A transactions closed this week for total consideration of $45M compared to four transactions for $68.5M in the prior year.
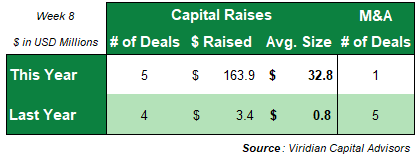
- One M&A transaction closed this week for non-disclosed value compared to five transactions for $15.91M in the prior year.
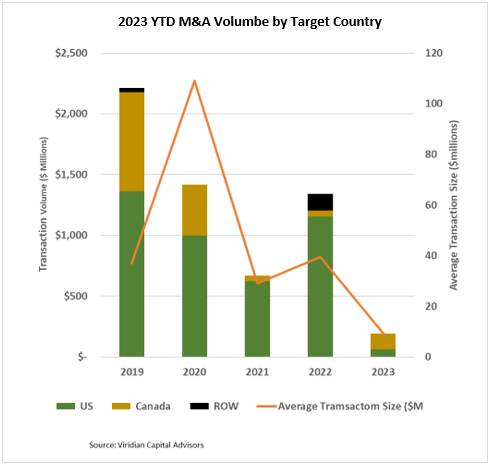
- Twenty-two transactions totaling $195.1M have closed YTD, compared to thirty-nine transactions for $1,358.3M last year.
- The 2023 YTD average transaction size of $8.87M and the 33% of total consideration accounted for by the U.S. are both the lowest in recent years.
-
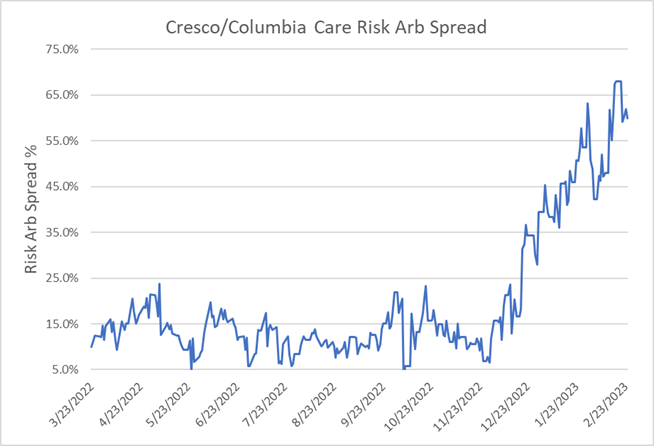
- The Cresco/Columbia deal spread narrowed by 800bp to 60% on 2/24/23, as the companies announced a three-month delay in the deal closing. The market breathed a collective sigh of relief as a three-month delay beats the other potentially bad news possibilities. Still, a 60% arb spread screams skepticism that the deal will survive as presently structured. An unannualized rate of return of 60% for a four-month investment seems too good to be true. If you think this deal will close, as does one noted sell-side analyst we respect, then why wouldn’t you try to establish the arb position of being long Columbia and short Cresco? Granted, the short side is difficult and expensive to maintain, but we don’t project 60% returns over the next four months anywhere else. What are we missing?
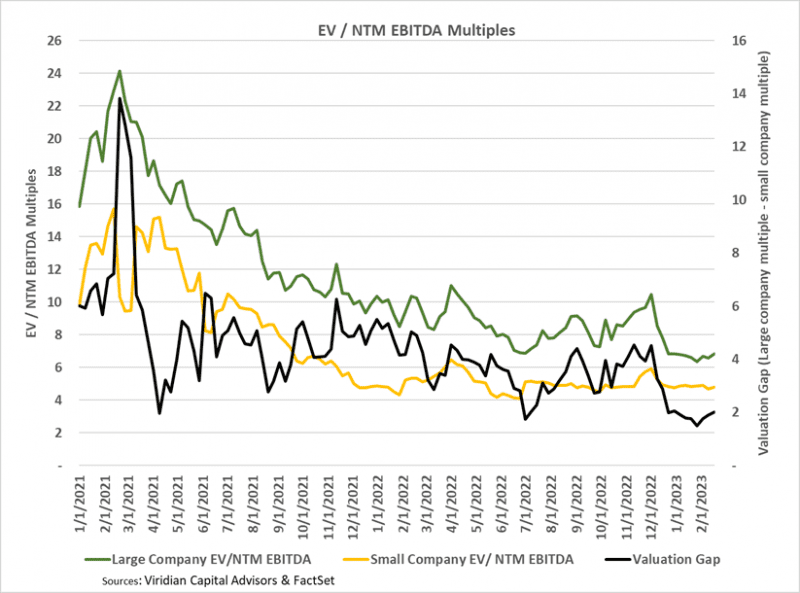
- The valuation gap narrowed to 1.81 on 2/24/23 but remained close to the lowest measure since we began tracking this measure and 136 bps lower than its 52-week average. The valuation gap is the difference between the EV/NTM EBITDA multiple for the largest MSOs and the multiple for the less than $300M market cap group, which are their primary targets.
- This measure has been a significant driver of M&A activity since a larger gap creates an opportunity for more accretive transactions. The gap tends to increase in improving markets while declining in retreating markets to the greater trading liquidity of the larger companies.