OUR 9TH YEAR OF PROVIDING PROPRIETARY CAPITAL MARKETS INTELLIGENCE ON THE CANNABIS / HEMP / PSYCHEDELIC SECTORS
Each week, Viridian publishes insights and analysis on completed M&A transactions in the prior week. Our analysis includes:
-
- M&A Market Commentary
- Public and Private Companies
- Buyers & Sellers
- YTD M&A Analysis
- M&A by Industry Sector
- Deal Structure and Valuation Analysis
- Pending Deal Risk Arb Analysis
- Valuation Gap Analysis
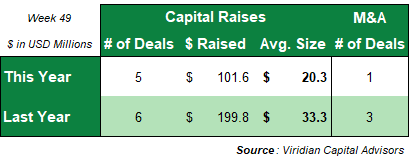
- One M&A transaction closed this week (with undisclosed terms) compared to three transactions for $187.3M in the prior year.
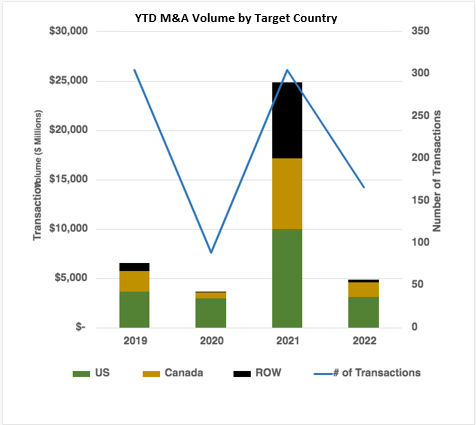
Total YTD M&A volume is down 80.4% from 2021, with $4.87B in consideration and 166 deals closed versus $24.86B in transaction value and 305 closings in 2021.
- Last year’s total included two of the largest M&A transactions ever done in cannabis, the $4.5B Tilray acquisition of Aphria and the $7.2B Jazz Pharma acquisition of GW Pharma. Without the two megadeals mentioned above, the volume in 2022 would trail 2021 by 63.0% YTD.
- We believe the likelihood of relatively sizeable public/public M&A transactions has increased significantly based on the low trading multiples of tier 2 and 3 MSOs and SSOs, particularly those perceived to be cash flow pressured.
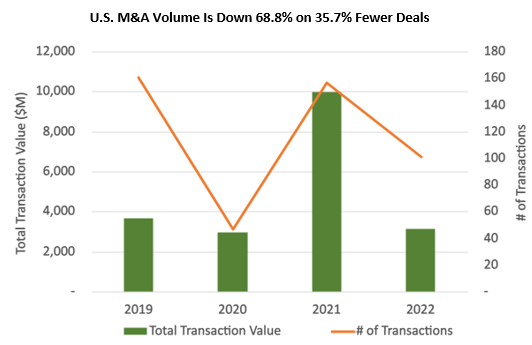
U.S. volume is down 68.8% YTD, with 35.7% fewer transactions.
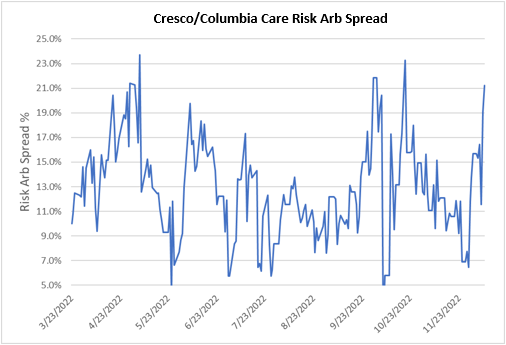
- The average transaction size of $30.8M is down 51.6% from 2021. Growth in transaction size will probably not be seen until early 2023 at the earliest as significant transactions have either been shelved (Verano/ Goodness Growth) or delayed into 2023 (Cresco/ Columbia).
- The Cresco/Columbia deal spread widened by 550 bp to 21.2% on 12/9/22. Management’s guidance of a late Q1 2023 closing seems credible, as several of the most significant obstacles have been cleared. The spread is now at levels that indicate significant market doubts about the likelihood of the transaction closing.