OUR 9TH YEAR OF PROVIDING PROPRIETARY CAPITAL MARKETS INTELLIGENCE ON THE CANNABIS / HEMP / PSYCHEDELIC SECTORS
Each week, Viridian publishes insights and analysis on completed M&A transactions in the prior week. Our analysis includes:
-
- M&A Market Commentary
- Public and Private Companies
- Buyers & Sellers
- YTD M&A Analysis
- M&A by Industry Sector
- Deal Structure and Valuation Analysis
- Pending Deal Risk Arb Analysis
- Valuation Gap Analysis
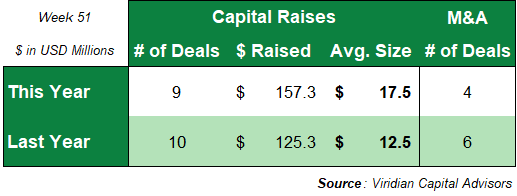
- Four M&A transactions closed this week for $9.7M, compared to six transactions for $61.0M in the prior year.
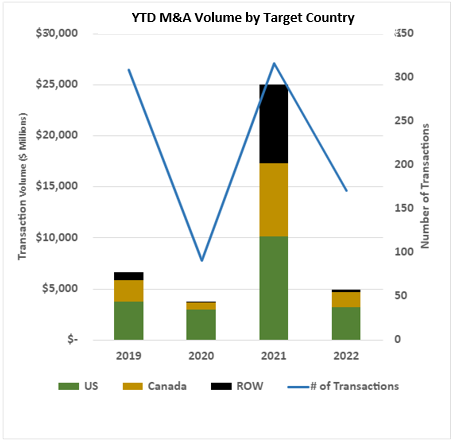
Total YTD M&A volume is down 80.3% from 2021, with $4.94B in consideration and 175 deals closed versus $25.02B in transaction value and 316 closings in 2021.
- Last year’s total included two of the largest M&A transactions ever done in cannabis, the $4.5B Tilray acquisition of Aphria and the $7.2B Jazz Pharma acquisition of GW Pharma. Without the two megadeals mentioned above, the volume in 2022 would trail 2021 by 62.9% YTD.
- We believe the likelihood of relatively sizeable public/public M&A transactions has increased significantly based on the low trading multiples of tier 2 and 3 MSOs and SSOs, particularly those perceived to be cash flow pressured.
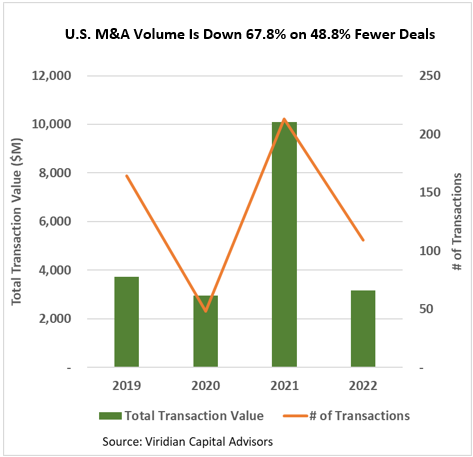
U.S. volume is down 68.7% YTD, with 48.8% fewer transactions.
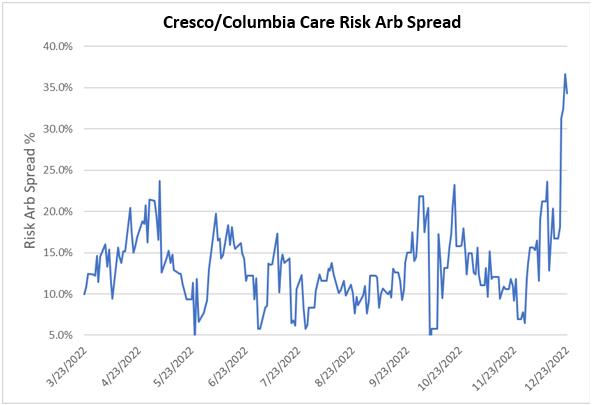
- The average transaction size of $29.1M is down 51.4% from 2021. Growth in transaction size will probably not be seen until early 2023 at the earliest as significant transactions have either been shelved (Verano/ Goodness Growth) or delayed into 2023 (Cresco/ Columbia).
- The Cresco/Columbia deal spread widened by 1760 bp to 34.3% on 12/23/22. Management of both companies continue to say that they are committed to closing the deal, but the current spread signals considerable market doubt. One of the top reasons for concern relates to the asset sales program. The Diddy deal closing is perhaps the most significant concern as it promises to fund $180M of cash for debt paydown post-closing. The transaction was inked before NY released its rules which say that ROs can only have three adult dispensaries (Diddy would have 4) and that they can only be medical for three years after the first adult sales in the market. Is it possible that the deal could break over this? The crash of equity prices has also reduced the likely proceeds from other planned asset sales in Ohio, Maryland, and Florida. The net result is a combined company with more debt than initially planned at refinancing rates that continue to climb. Still, the deal has gone a long way down the tracks towards closing, and an unannualized rate of return of 34% for a 3-month investment seems like an attractive speculation.