OUR 9TH YEAR OF PROVIDING PROPRIETARY CAPITAL MARKETS INTELLIGENCE ON THE CANNABIS / HEMP / PSYCHEDELIC SECTORS
Each week, Viridian publishes insights and analysis on completed M&A transactions in the prior week. Our analysis includes:
-
- M&A Market Commentary
- Public and Private Companies
- Buyers & Sellers
- YTD M&A Analysis
- M&A by Industry Sector
- Deal Structure and Valuation Analysis
- Pending Deal Risk Arb Analysis
- Valuation Gap Analysis
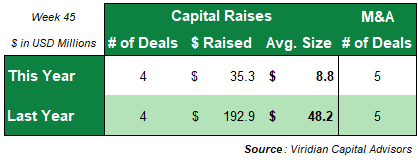
- Six M&A transactions closed this week for disclosed consideration of $3.8M compared to five transactions for $168.7M in the prior year.
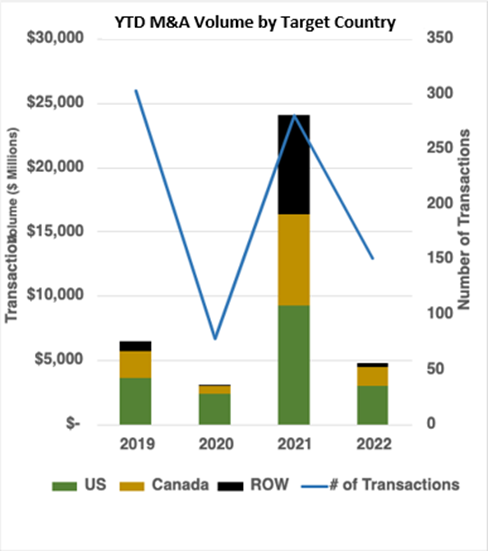
Total YTD M&A volume is down 80.2% from 2021, with $4.80B in consideration and 163 deals closed versus $24.19B in transaction value and 286 closings in 2021.
- Last year’s total included two of the largest M&A transactions ever done in cannabis, the $4.5B Tilray acquisition of Aphria and the $7.2B Jazz Pharma acquisition of GW Pharma. Without the two megadeals mentioned above, the volume in 2022 would trail 2021 by 61.1% YTD.
- We believe the likelihood of relatively sizeable public/public M&A transactions has increased significantly based on the low trading multiples of tier 2 and 3 MSOs and SSOs, particularly those perceived to be cash flow pressured.
U.S. volume is down 67.8% YTD, with 32.7% fewer transactions.
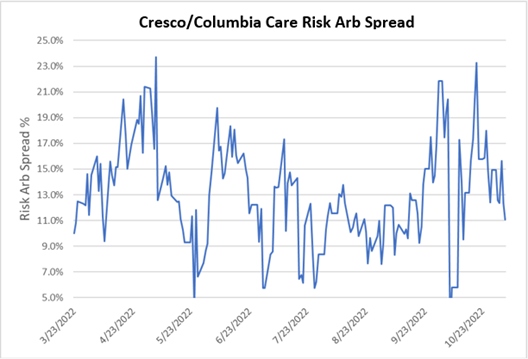
- The average transaction size of $30.7M is down 52.1% from 2021. Growth in transaction size will probably not be seen until early 2023 at the earliest as significant transactions have either been shelved (Verano/ Goodness Growth) or delayed into 2023 (Cresco/ Columbia).
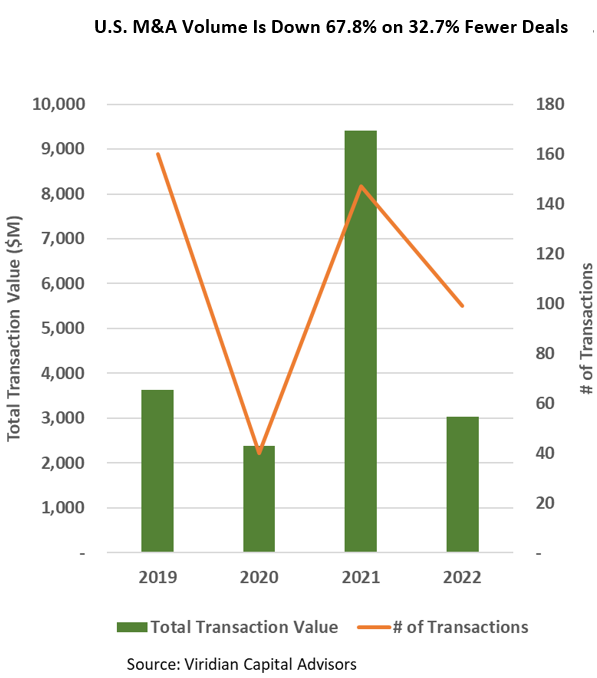
- The Cresco/Columbia deal spread widened by 100 bp to 12.1% on 11/11/22. We are surprised that last week’s announcement that Sean “Diddy” Combes was acquiring assets from Cresco and Columbia for $185M, bringing the transaction closer to completion, didn’t have more of a positive impact. Management is now guiding towards a Q1 2023 closing.
-
-
-
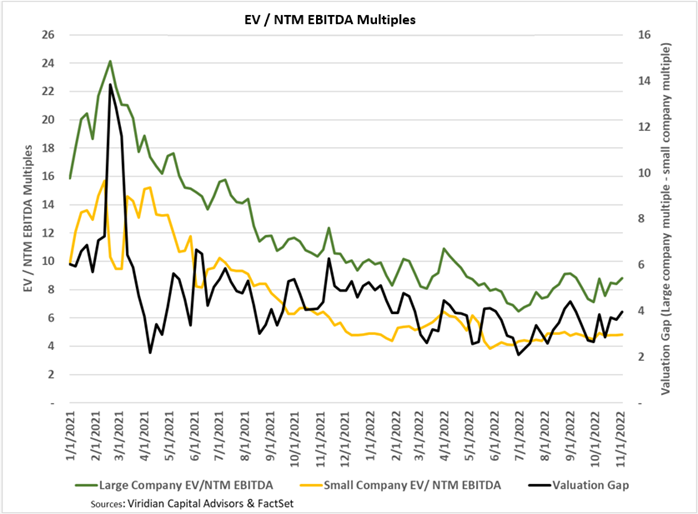
- The valuation gap widened to 4.35 on 11/11/22, the highest since the first quarter’s end. The valuation gap is the difference between the EV/NTM EBITDA multiple for the largest MSOs and the multiple for the less than $300M market cap group, which are their primary targets.
- This measure has been a significant driver of M&A activity since a larger gap creates an opportunity for more accretive transactions. The gap tends to increase in improving markets while declining in retreating markets.
- A gap of over 4 points is conducive to accretive transactions between the largest MSOs and smaller competitors. At the same time, a tighter financing market makes it more challenging for small companies to finance the growth of their business.
- We note that the gap is based on trading prices and not on values where a company could raise significant amounts of capital. The difference is crucial because one of the key drivers we see for accelerating M&A activity is the inability of smaller companies to finance themselves in the current cannabis capital markets

-
-