OUR 9TH YEAR OF PROVIDING PROPRIETARY CAPITAL MARKETS INTELLIGENCE ON THE CANNABIS / HEMP / PSYCHEDELIC SECTORS
Each week, Viridian publishes insights and analysis on completed M&A transactions in the prior week. Our analysis includes:
-
- M&A Market Commentary
- Public and Private Companies
- Buyers & Sellers
- YTD M&A Analysis
- M&A by Industry Sector
- Deal Structure and Valuation Analysis
- Pending Deal Risk Arb Analysis
- Valuation Gap Analysis
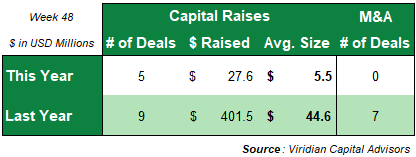
- Zero M&A transactions closed this week compared to seven transactions for $275.3M in the prior year.
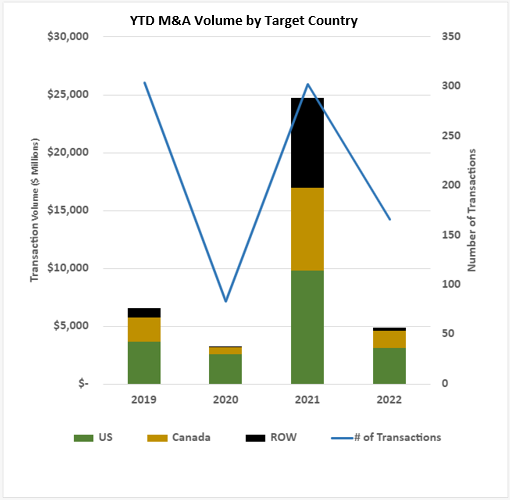
Total YTD M&A volume is down 80.3% from 2021, with $4.87B in consideration and 166 deals closed versus $24.67B in transaction value and 302 closings in 2021.
- Last year’s total included two of the largest M&A transactions ever done in cannabis, the $4.5B Tilray acquisition of Aphria and the $7.2B Jazz Pharma acquisition of GW Pharma. Without the two megadeals mentioned above, the volume in 2022 would trail 2021 by 62.4% YTD.
- We believe the likelihood of relatively sizeable public/public M&A transactions has increased significantly based on the low trading multiples of tier 2 and 3 MSOs and SSOs, particularly those perceived to be cash flow pressured.
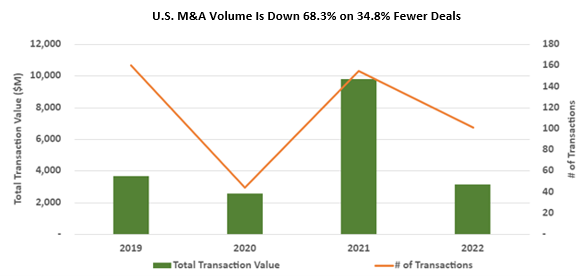
U.S. volume is down 68.3% YTD, with 34.8% fewer transactions.
- The average transaction size of $30.8M is down 51.3% from 2021. Growth in transaction size will probably not be seen until early 2023 at the earliest as significant transactions have either been shelved (Verano/ Goodness Growth) or delayed into 2023 (Cresco/ Columbia).
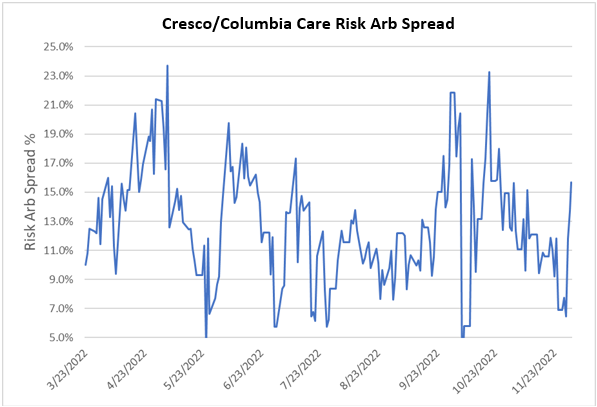
- The Cresco/Columbia deal spread widened by 880 bp to 15.7% on 11/25/22. Management’s guidance of a late Q1 2023 closing seems credible, as several of the most significant obstacles have been cleared. We saw no news to account for the substantial widening in the arb spread. Perhaps panic short covering of Cresco?
-
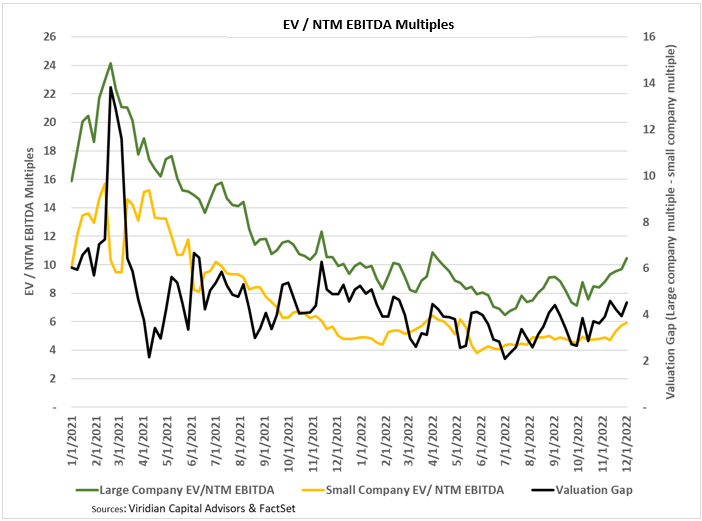
- The valuation gap narrowed to 4.53 on 12/2/22, 106 bps higher than its LTM average. The valuation gap is the difference between the EV/NTM EBITDA multiple for the largest MSOs and the multiple for the less than $300M market cap group, which are their primary targets.
- This measure has been a significant driver of M&A activity since a larger gap creates an opportunity for more accretive transactions. The gap tends to increase in improving markets while declining in retreating markets.
- A gap of over 4 points is conducive to accretive transactions between the largest MSOs and smaller competitors. At the same time, a tighter financing market makes it more challenging for small companies to finance the growth of their business.
- We note that the gap is based on trading prices and not on values where a company could raise significant amounts of capital. The difference is crucial because one of the key drivers we see for accelerating M&A activity is the inability of smaller companies to finance themselves in the current cannabis capital markets.