OUR 9TH YEAR OF PROVIDING PROPRIETARY CAPITAL MARKETS INTELLIGENCE ON THE CANNABIS / HEMP / PSYCHEDELIC SECTORS
Each week, Viridian publishes insights and analysis on completed M&A transactions in the prior week. Our analysis includes:
-
- M&A Market Commentary
- Public and Private Companies
- Buyers & Sellers
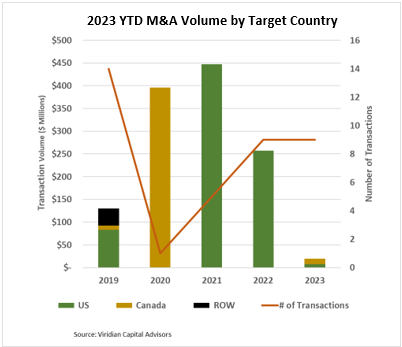
- YTD M&A Analysis
- M&A by Industry Sector
- Deal Structure and Valuation Analysis
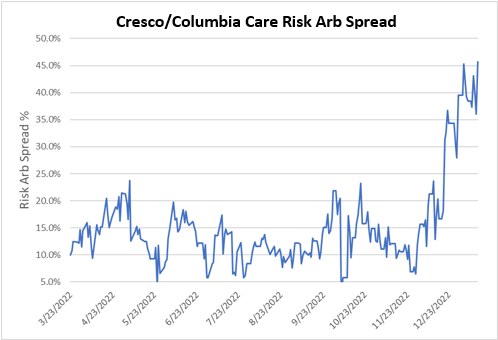
- Pending Deal Risk Arb Analysis
- Valuation Gap Analysis
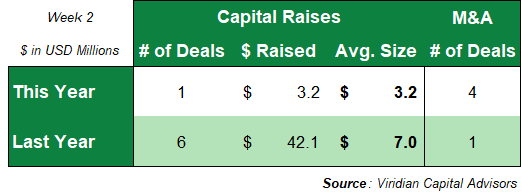
- Four M&A transactions closed this week for $8.9M, compared to one transaction for $0.5M in the prior year.
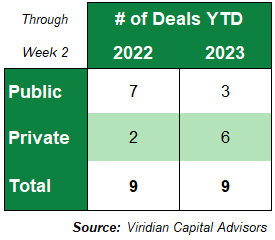
- Nine transactions totaling $19.9M have closed YTD, compared to nine transactions for $257.4M last year.
- We believe the likelihood of relatively sizeable public/public M&A transactions has increased significantly based on the low trading multiples of tier 2 and 3 MSOs and SSOs, particularly those perceived to be cash flow pressured.
- The Cresco/Columbia deal spread widened by 730bp to 45.7% on 1/13/23. This spread signals considerable market doubt about closing this transaction despite both companies continuing to say that they are committed to the deal. The Diddy deal closing is the most significant concern as it promises to fund $180M of cash for debt paydown post-closing. The crash of equity prices has also reduced the likely proceeds from other planned asset sales in Ohio, Maryland, and Florida. Still, the deal has made significant progress towards closing, and an unannualized rate of return of 46% for a 3-month investment seems like an attractive speculation. The market is clearly saying it’s too good to be true.