OUR 9TH YEAR OF PROVIDING PROPRIETARY CAPITAL MARKETS INTELLIGENCE ON THE CANNABIS / HEMP / PSYCHEDELIC SECTORS
Each week, Viridian publishes insights and analysis on completed M&A transactions in the prior week. Our analysis includes:
-
- M&A Market Commentary
- Public and Private Companies
- Buyers & Sellers
- YTD M&A Analysis
- M&A by Industry Sector
- Deal Structure and Valuation Analysis
- Pending Deal Risk Arb Analysis
- Valuation Gap Analysis
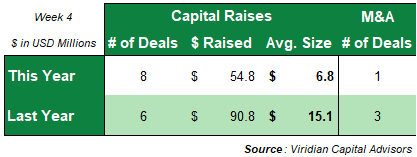
- One M&A transaction closed this week, for $0.65M, compared to three transactions for $30.0M in the prior year.
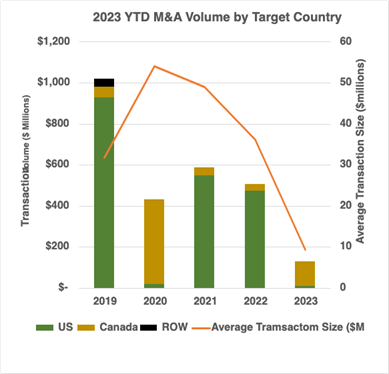
- Fourteen transactions totaling $131.1M have closed YTD, compared to fourteen transactions for $506.5M last year.
- The 2023 average transaction size of $9.4M is the lowest in recent years, and unlike most of the previous years (except 2020), the U.S. has accounted for less than 10% of the total.
- We believe the likelihood of relatively sizeable public/public M&A transactions has increased significantly based on the low trading multiples of tier 2 and 3 MSOs and SSOs, particularly those perceived to be cash flow pressured.
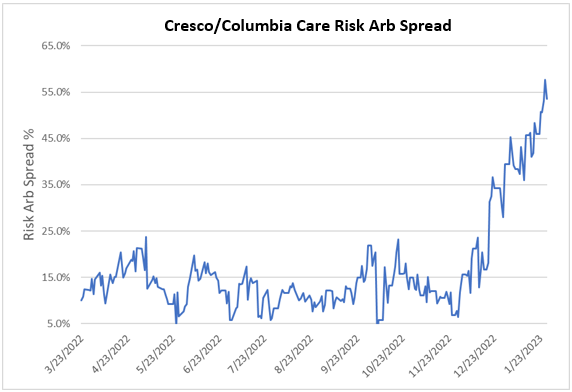
- The Cresco/Columbia deal spread widened by 760bp to 53.6% on 1/27/23. This spread signals considerable market doubt about closing this transaction despite both companies continuing to say that they are committed to the deal. Market rumors regarding the closing of the Diddy transaction have not helped. The crash of equity prices has also reduced the likely proceeds from other planned asset sales in Ohio and Florida and probably extended the timeline into the 2nd quarter. The deal has made significant progress towards closing, but an unannualized rate of return of 54% for a 3-6 month investment seems too good to be true. Will this transaction fall apart or be recut somehow? What are we missing here?
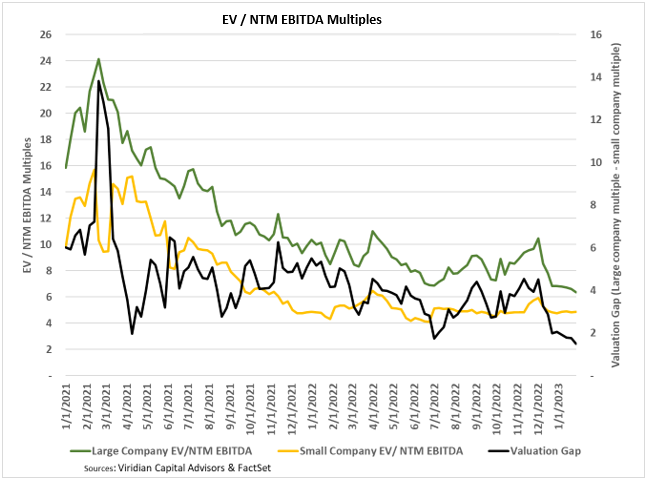
- The valuation gap narrowed to 1.49 on 1/27/23, a new low since we began tracking this measure and 189 bps lower than its 52-week average. The valuation gap is the difference between the EV/NTM EBITDA multiple for the largest MSOs and the multiple for the less than $300M market cap group, which are their primary targets.
- This measure has been a significant driver of M&A activity since a larger gap creates an opportunity for more accretive transactions. The gap tends to increase in improving markets while declining in retreating markets to the greater trading liquidity of the larger companies.
- The gap has plunged primarily because the Tier one stocks are significantly more liquid and have accordingly traded down more sharply. In a chaotic market, the small company trading multiples may not be a good guide to the prices at which these companies would sell in an M&A setting.