OUR 9TH YEAR OF PROVIDING PROPRIETARY CAPITAL MARKETS INTELLIGENCE ON THE CANNABIS / HEMP / PSYCHEDELIC SECTORS

Capital Raises

Equity Capital Raises

Equity Transaction Chart

Viridian publishes weekly data on equity capital raises in the Cannabis/CBD/Psychedelic industries. This data includes information about the company issuing equity (public/private, state/country location), deal size, deal structure, pricing, share information, deal implied valuation, and warrant information.

Week ended 10/27/2023

Week ended 10/27/2023

This Section is Only Available to Higher Tier Memberships

Please Purchase a Premium or Enterprise membership to see more.

Equity Commentary

Viridian publishes weekly insights on equity capital raises in the Cannabis/CBD/Psychedelic industries. These insights typically highlight the most interesting/meaningful equity transactions of that week, and commentary on market conditions, equity deal structures and investor groups.

Week ended 10/27/2023

  • The Week’s Two Closed Equity Deals
    • On October 26, 2023, lnMed Pharmaceuticals. (INM: Nasdaq), a Vancouver-based pharmaceutical company involved in the R&D, manufacturing, and commercialization of rare cannabinoids, raised approximately $5.2 million through a private placement of pre-funded warrants to purchase common shares and the exercise of previously issued warrants.
    • Approximately 3.01M new pre-funded warrants were issued at the equivalent of $0.83 per share for proceeds of $2.5M
    • Outstanding options issued in 2022 for 3.272 million shares were exercised at a reduced exercise price of $0.83 per share for total proceeds of $2.7M. In exchange for the conversion, holders were issued 6.545M new options with exercise prices of $0.83 per share and a 5.5-year maturity.
    • Taken as a whole, and considering the high value of the warrants, the transaction issued 6.28M shares at a net share price of approximately $0.51. The stock trades at roughly $.51 per share, ratifying our net share price calculation.
    • The deal implies a $4.8M market cap but a negative $9.4M enterprise value. The company has only about $.3M of debt but proforma cash of approximately $14M. The market appears to be discounting the value of the cash held because the company is burning about $7-10M cash annually through R&D and SG&A expenses.
    • Total cash should now be sufficient to fund ongoing expenses for 2024.
    • On October 23, 2023, 4Front Ventures (FFNT: CSE)(FFNTF: OTCQX) issued 15.9M Restricted Stock Units (RSUs) at $0.28 per share for total gross proceeds of $3.55M.
    • Proforma for the issue: the company’s liquidity still looks tight, with proforma free cash flow adjusted current ratio of 1.02x. Indicating the company should probably issue more equity if prices recover a bit.
    • The RSU issue shows a level of commitment by Altmore to make sure the company is adequately funded to get the Illinois facilities fully up and running. Investors will look closely at the upcoming 3rd quarter earnings release and call.

Public vs. Private Raises: 

  • Both of the week’s capital raisers are public companies that trade in the U.S. (one on Nasdaq and one on OTC) and Canada (one on the CSE and one on the TSX).

Equity vs. Debt Cap Raises: 

  • Equity accounted for 100% of the week’s capital raised.

Week ended 10/27/2023

Additional content is available to Premium and Enterprise users. Please purchase a higher tier membership to see more. 

Weekly Valuation Tracker

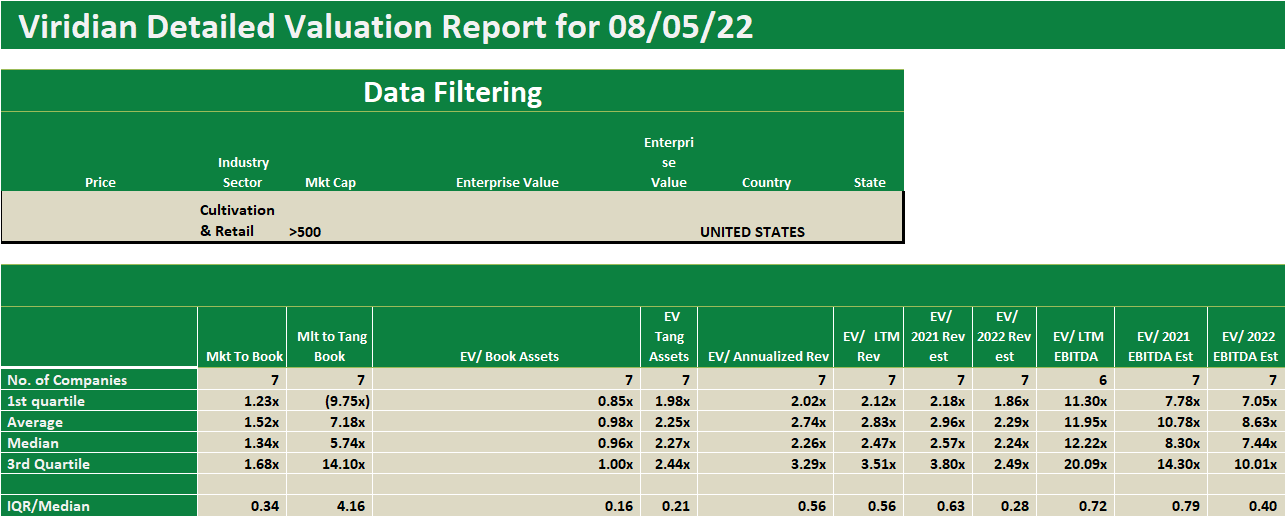
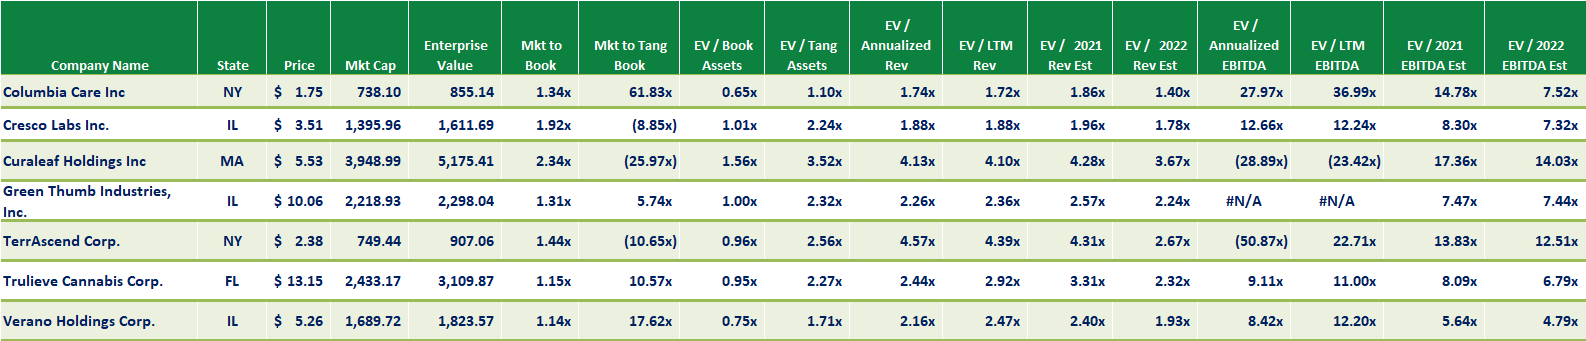
Viridian highlights a specific industry sector and provides a deep dive into valuation metrics and comparable company valuations for public companies operating in that sector.  The Weekly Valuation Tracker provides proprietary, actionable valuation data.

This week’s valuation tracker focuses on the 7 U.S. MSOs with market cap over $500M in the Viridian Value Tracker database in gauge the valuation impact of the 2nd earnings that have been released so far, Green Thumb (GTII: CSE), Curaleaf (CURA: CSE), and Trulieve.   

This Chart is Only Available to Higher Tier Memberships

Please Purchase a Premium or Enterprise membership to see more.

Additional content is available to Premium and Enterprise users. Please purchase a higher tier membership to see more. 

This Chart is Only Available to Higher Tier Memberships

Please Purchase a Premium or Enterprise membership to see more.