OUR 9TH YEAR OF PROVIDING PROPRIETARY CAPITAL MARKETS INTELLIGENCE ON THE CANNABIS / HEMP / PSYCHEDELIC SECTORS
Viridian publishes weekly data and analysis on debt capital raises in the Cannabis/CBD/Psychedelic industries. This data includes information about the company issuing debt (public/private, state/country location), deal size, deal structure, pricing, warrants, and credit data.


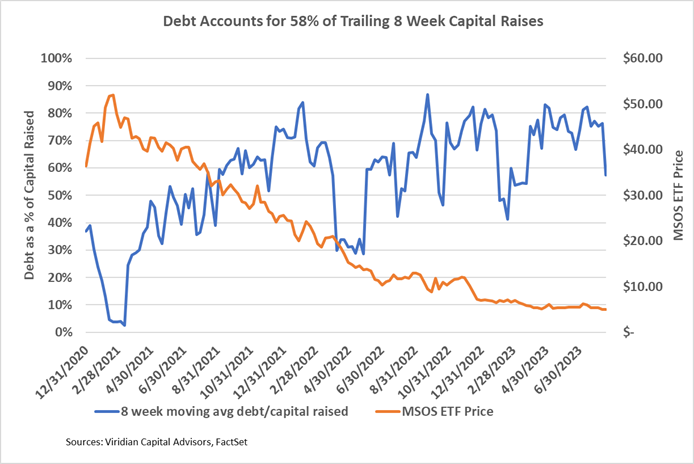
- Debt accounted for 58% of trailing 8-week capital raises, down sharply due to the significant Compass Pathways equity transaction. We expect this ratio to be volatile because of the limited capital raise activity. With cannabis stocks trading at or near their 52-week lows, we expect debt to continue to account for more than 50% of capital raises. Several large MSOs have now come close to maxing out their debt capacity and may be forced to issue equity, even at the cost of dilution.
The Week’s Only Closed Debt Issue:
- On August 14, 2023, MindMed (MNMD: Nasdaq), a clinical-stage biopharmaceutical company, which engages in developing novel product candidates to treat brain health disorders, closed a $15M First Tranche of a $50M Senior Secured Credit Facility.
- The facility matures on 8/1/27 and is secured by substantially all of the Borrower’s assets, excluding intellectual property. The interest rate is the greater of 10.95% or prime plus 2.95%.
- Lenders may convert up to $4.0M of the facility into common shares at $4.01 per share (a discount of approximately 10.3% from the closing price of the stock)
- The conversion option (equal to approximately 27% warrant coverage) is quite valuable, representing about 9.22 bond points and raising the effective cost of the transaction to 14.0%
- The company’s free cash flow adjusted current ratio, proforma for the transaction, is 2.25x, adequate to fund operations through 2024. The company had $132M of cash as of June 2023 (proforma for the transaction) and has a negative cash flow from operations of approximately $13.9M per quarter.
- The second tranche of $20M is available subject to meeting certain time-based, clinical, and regulatory milestones. A third tranche of $15M is subject to discretionary approval by the Lenders.
- The lenders include K2 HealthVentures LLC as Administrative Agent and Ankura Trust Company LLC as collateral trustee.
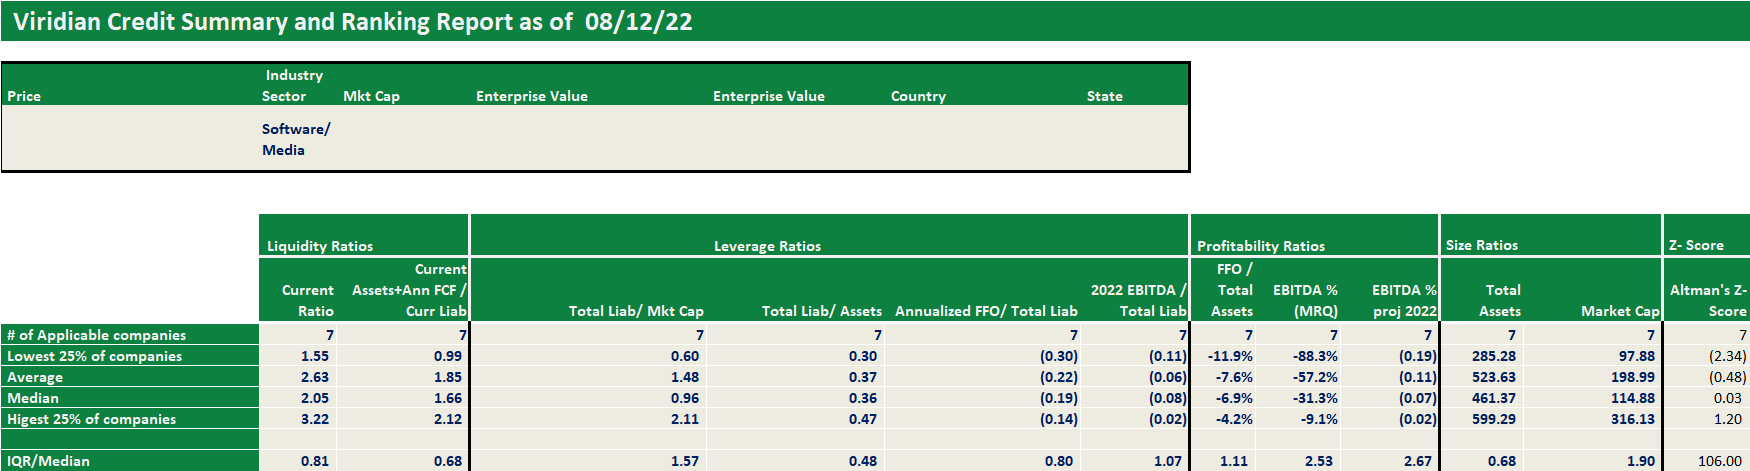
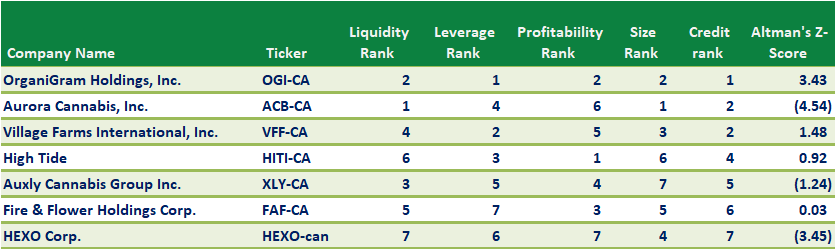
Each week, Viridian highlights a specific industry sector and provides a deep dive into credit metrics and comparable company credit rankings for public companies operating in that sector. Credit ratings are not currently available for public cannabis companies leaving companies, lenders, and investors with a gap of information. The Viridian Cannabis Credit Tracker fills this gap. The model uses 11 market and financial statement variables to discern 4 key credit factors: Liquidity, Leverage, Profitability, and Size, to provide credit/liquidity analysis for over 370 public Cannabis/Hemp companies.
Viridian publishes weekly insights on debt capital raises in the Cannabis/CBD/Psychedelic industries. These insights typically highlight the most interesting/meaningful debt transactions of that week, and commentary on market conditions, debt deal structures, and lenders.