OUR 9TH YEAR OF PROVIDING PROPRIETARY CAPITAL MARKETS INTELLIGENCE ON THE CANNABIS / HEMP / PSYCHEDELIC SECTORS
Viridian publishes weekly data and analysis on debt capital raises in the Cannabis/CBD/Psychedelic industries. This data includes information about the company issuing debt (public/private, state/country location), deal size, deal structure, pricing, warrants, and credit data.


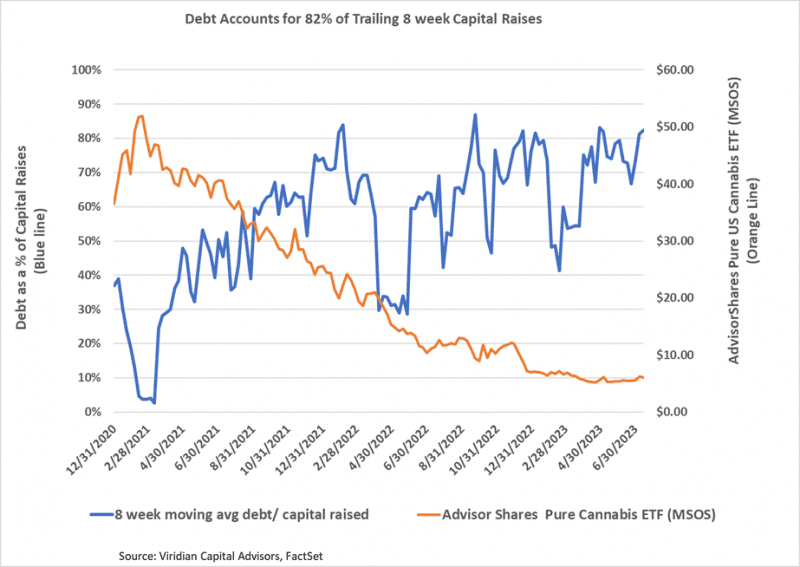
- Debt accounted for 82% of trailing 8-week capital raises. We expect this ratio to be volatile because of the limited capital raise activity. With cannabis stocks trading at or near their 52-week lows, we expect debt to continue to account for more than 50% of capital raises. Several large MSOs have now come close to maxing out their debt capacity and may be forced to issue equity, even at the cost of dilution.
The Week’s Only Closed Debt Issue:
- On July 13, 2023, Grown Rogue Intl. (GRIN: CSE)(GRUSF: OTC), a $30M market cap, vertically integrated operator in Oregon & Michigan, completed a $5M non-brokered private placement of unsecured Convertible Debenture with attached warrants.
- The debentures have a four-year maturity, a 9% coupon, and are convertible at $.18 per share (a 5.88% premium)
- Approximately 13.74M three-year warrants with an exercise price of $.18 per share (a 5.88% premium) were attached. Warrant coverage is 49.5% for a total coverage of 149.5%, including convertibility.
- The low conversion and warrant exercise premiums are quite valuable, and taking these into account, we calculate an effective rate of 23.5%.
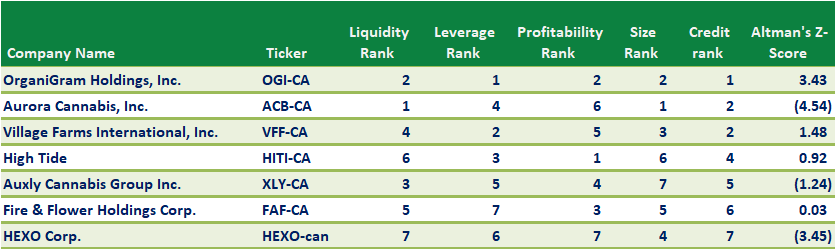
- We rank Grown Rogue among the top five MSOs in the Viridian Capital Credit Tracker model. The company has extremely low leverage on both a market and EBITDA turn basis, and excellent liquidity. It is positive cash flow on both an operating and free cash flow basis. The company has achieved these results while operating in two of the most competitive markets in the country, which speak volumes about its management.
- The financing was led by Mindset Capital, a private investment firm focused on the cannabis industry. Mindset also led Grown Rogue’s previous financing round.
- Proceeds will fund expansion into additional markets.
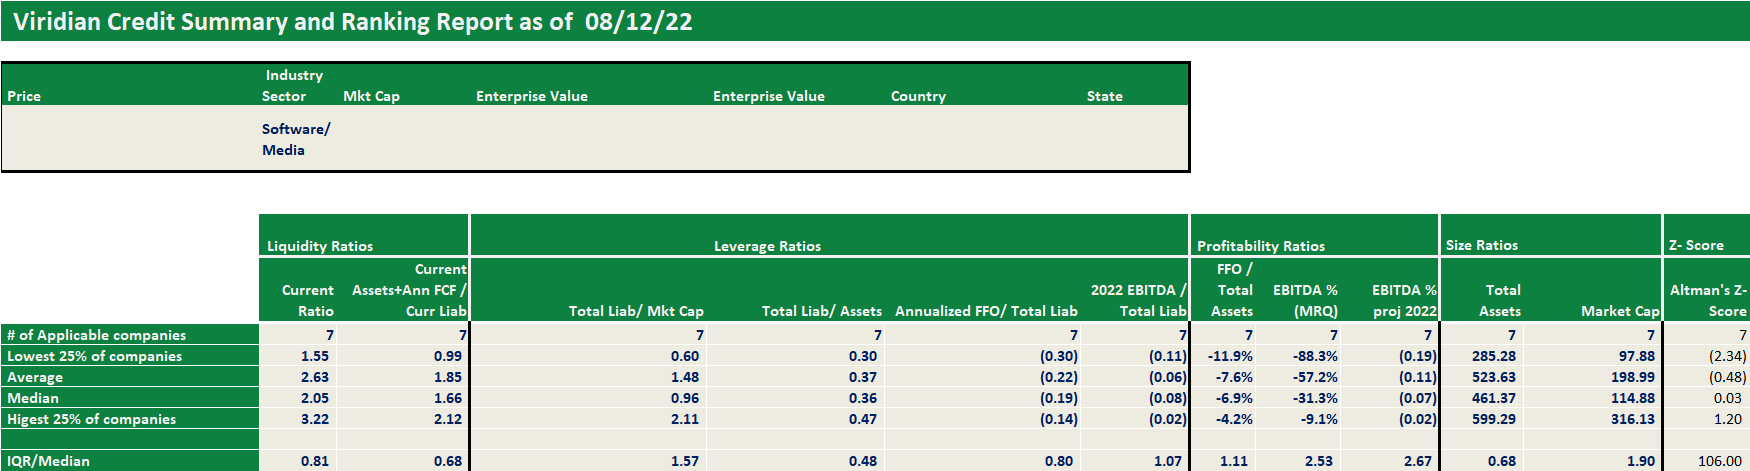
Each week, Viridian highlights a specific industry sector and provides a deep dive into credit metrics and comparable company credit rankings for public companies operating in that sector. Credit ratings are not currently available for public cannabis companies leaving companies, lenders, and investors with a gap of information. The Viridian Cannabis Credit Tracker fills this gap. The model uses 11 market and financial statement variables to discern 4 key credit factors: Liquidity, Leverage, Profitability, and Size, to provide credit/liquidity analysis for over 370 public Cannabis/Hemp companies.
Viridian publishes weekly insights on debt capital raises in the Cannabis/CBD/Psychedelic industries. These insights typically highlight the most interesting/meaningful debt transactions of that week, and commentary on market conditions, debt deal structures, and lenders.