OUR 9TH YEAR OF PROVIDING PROPRIETARY CAPITAL MARKETS INTELLIGENCE ON THE CANNABIS / HEMP / PSYCHEDELIC SECTORS
Viridian publishes weekly data and analysis on debt capital raises in the Cannabis/CBD/Psychedelic industries. This data includes information about the company issuing debt (public/private, state/country location), deal size, deal structure, pricing, warrants, and credit data.


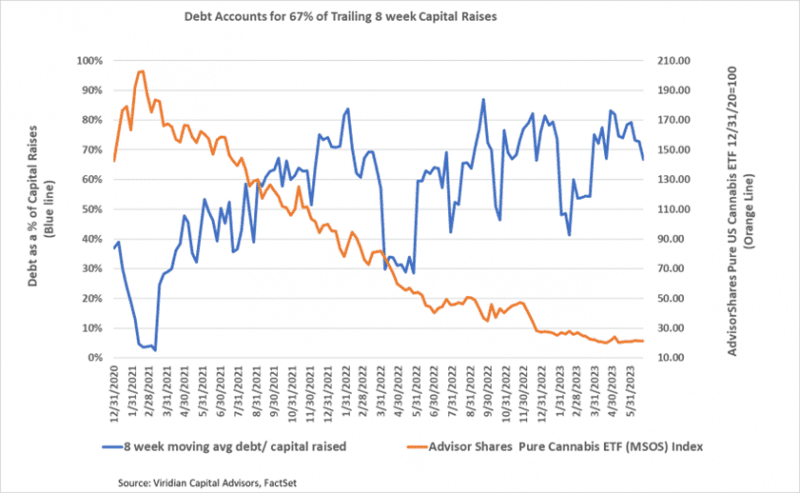
- Debt accounted for 67% of trailing 8-week capital raises. We expect this ratio to be volatile because of the limited capital raise activity. With cannabis stocks trading at or near their 52-week lows, we expect debt to continue to account for more than 50% of capital raises. Several large MSOs have now come close to maxing out their debt capacity and may be forced to issue equity, even at the cost of dilution. See our Insights section for more explanation.
The Week’s Only Closed Debt Issue:
- On June 23, 2023, TerrAscend Corp. (TER: CSE)(TRSSF: OTCQX), The sixth-largest U.S. MSO by market cap, closed a private placement of a US$9.91M private placement of convertible debenture units.
- The debentures have a 9.9% coupon, mature in three years, and are convertible at US$2.01 (a 17.5% premium).
- The debentures also came with 300,000 warrants with 2-year maturities and 14% exercise premiums.
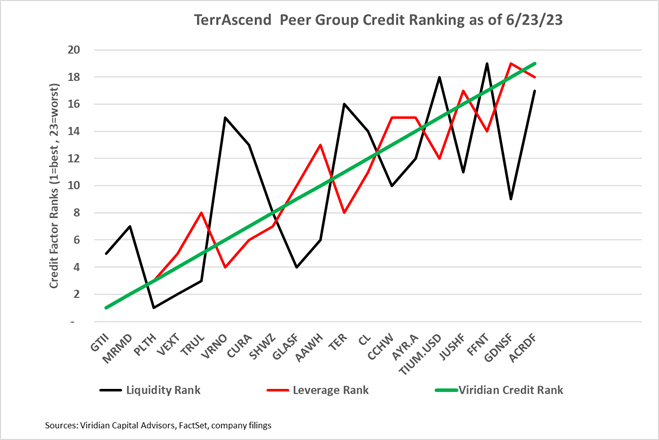
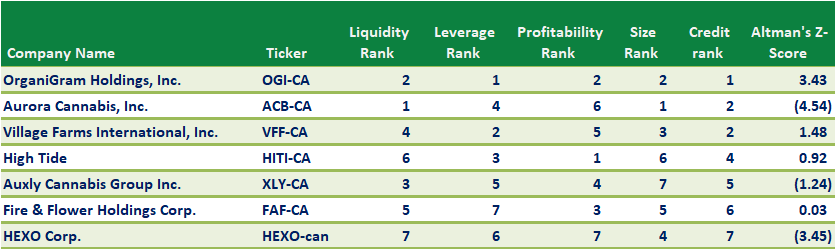
- The debenture conversion option and the warrants have a combined value of approximately 17.11 points of bond value, producing an effective cost of 17.5%, which is appropriate given our assessment of TerrAscend’s relative credit quality. The graph below shows TerrAscend’s 11/19 ranking in the Viridian Credit model compared to its peer group. TER benefits from high stock valuation, driving down its market leverage and offsetting its below-average liquidity and profitability. See this week’s Viridian Credit Tracker for more details.
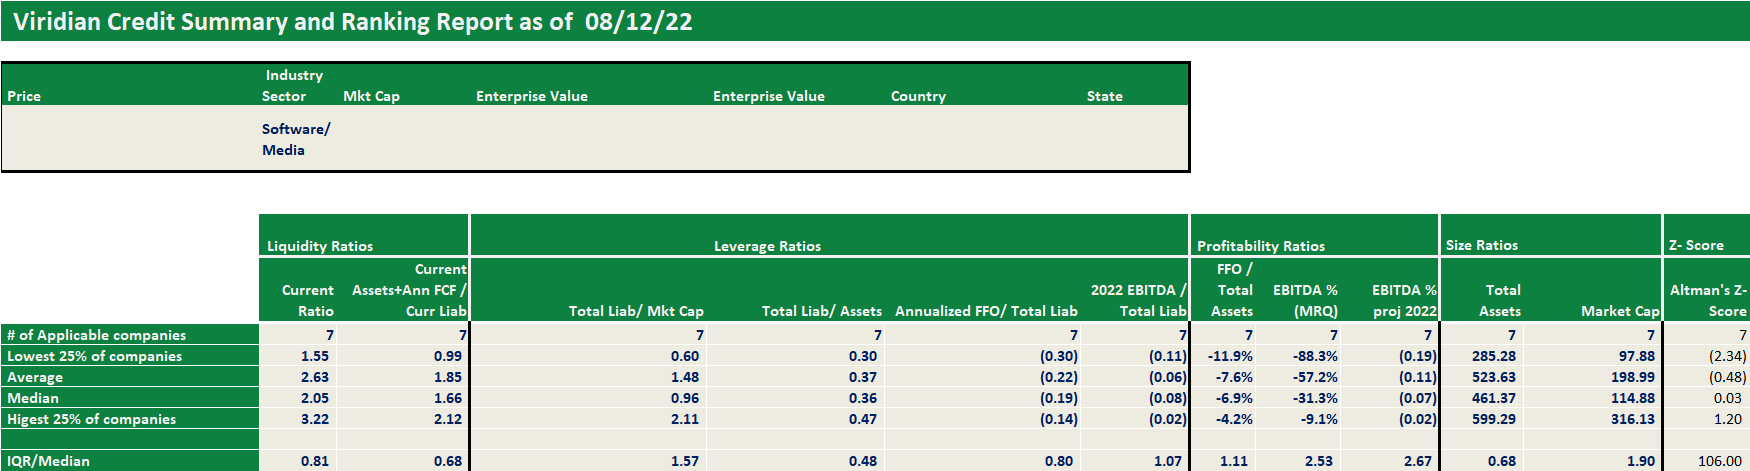
Each week, Viridian highlights a specific industry sector and provides a deep dive into credit metrics and comparable company credit rankings for public companies operating in that sector. Credit ratings are not currently available for public cannabis companies leaving companies, lenders, and investors with a gap of information. The Viridian Cannabis Credit Tracker fills this gap. The model uses 11 market and financial statement variables to discern 4 key credit factors: Liquidity, Leverage, Profitability, and Size, to provide credit/liquidity analysis for over 370 public Cannabis/Hemp companies.
Viridian publishes weekly insights on debt capital raises in the Cannabis/CBD/Psychedelic industries. These insights typically highlight the most interesting/meaningful debt transactions of that week, and commentary on market conditions, debt deal structures, and lenders.