OUR 9TH YEAR OF PROVIDING PROPRIETARY CAPITAL MARKETS INTELLIGENCE ON THE CANNABIS / HEMP / PSYCHEDELIC SECTORS
Viridian publishes weekly data and analysis on debt capital raises in the Cannabis/CBD/Psychedelic industries. This data includes information about the company issuing debt (public/private, state/country location), deal size, deal structure, pricing, warrants, and credit data.


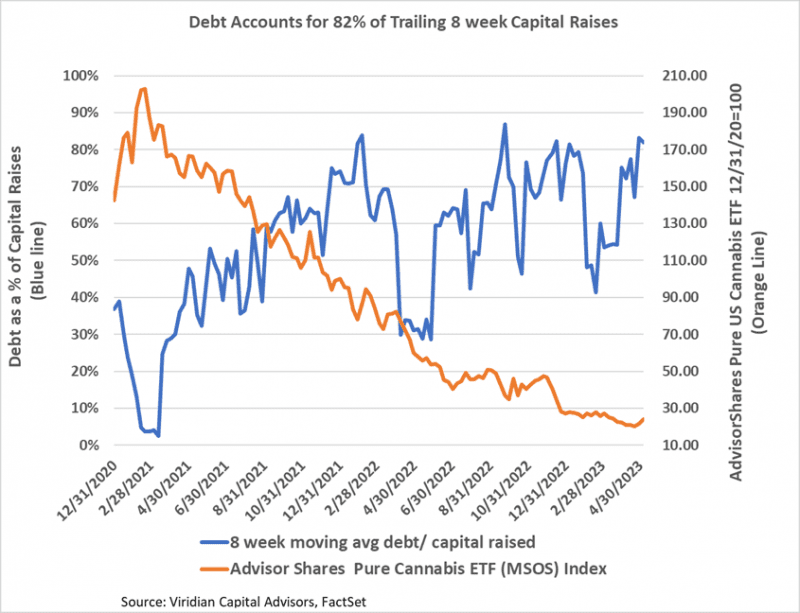
- Debt accounted for 80% of trailing 4-week capital raises. We expect this ratio to be volatile because of the limited capital raise activity. With cannabis stocks trading at or near their 52-week lows, we expect debt to continue to account for more than 50% of capital raises. Since year-end, debt costs have significantly increased because of higher treasury rates and risk spreads. We expect continued increases in equity-linked structures.
The Week’s Largest Closed Debt Raise:
- On May 4, 2023, cbdMD (YCBD: AMEX) announced closing a $2.84M public offering of 1.35M shares at $2.10.
- cbdMD is the second largest U.S. Hemp company, with a transaction implied market cap of approximately $32.6M and an enterprise value of $39.5M.
- The equity sale values the company at approximately 1.23x LTM revenues and 1.62x annualized quarterly revenues, significant premiums to the .6x and .82x we calculated as the respective medians for the five U.S. Hemp sector companies with market caps over $10M in the Viridian Capital Value Tracker database. Our Weekly Value Tracker section will provide more detail on the competitors and how they are valued.
- Proceeds will be used for general working capital purposes and to fund selective acquisitions.
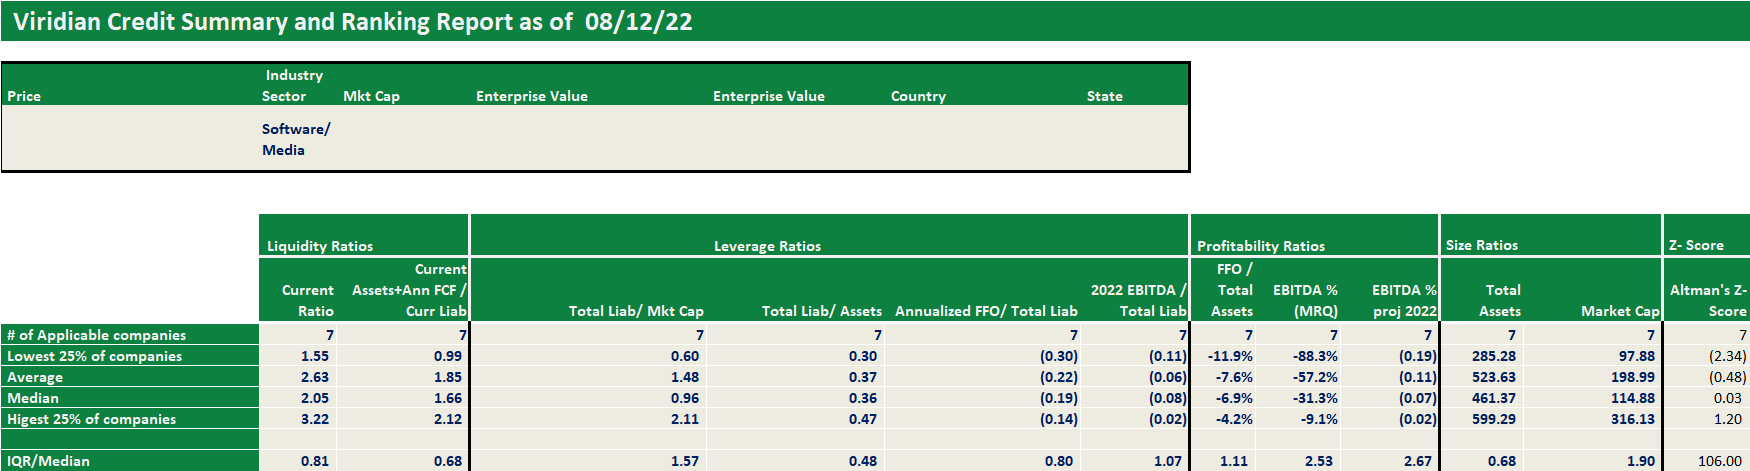
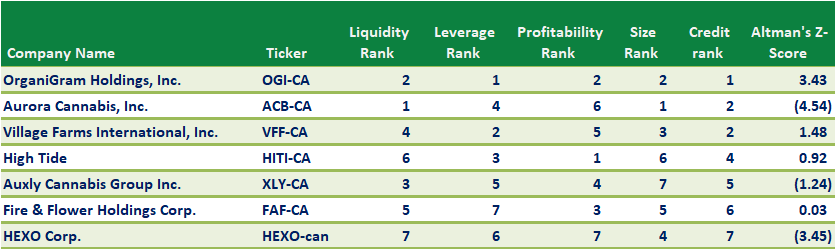
Each week, Viridian highlights a specific industry sector and provides a deep dive into credit metrics and comparable company credit rankings for public companies operating in that sector. Credit ratings are not currently available for public cannabis companies leaving companies, lenders, and investors with a gap of information. The Viridian Cannabis Credit Tracker fills this gap. The model uses 11 market and financial statement variables to discern 4 key credit factors: Liquidity, Leverage, Profitability, and Size, to provide credit/liquidity analysis for over 370 public Cannabis/Hemp companies.
Viridian publishes weekly insights on debt capital raises in the Cannabis/CBD/Psychedelic industries. These insights typically highlight the most interesting/meaningful debt transactions of that week, and commentary on market conditions, debt deal structures, and lenders.