OUR 9TH YEAR OF PROVIDING PROPRIETARY CAPITAL MARKETS INTELLIGENCE ON THE CANNABIS / HEMP / PSYCHEDELIC SECTORS
Viridian publishes weekly data and analysis on debt capital raises in the Cannabis/CBD/Psychedelic industries. This data includes information about the company issuing debt (public/private, state/country location), deal size, deal structure, pricing, warrants, and credit data.
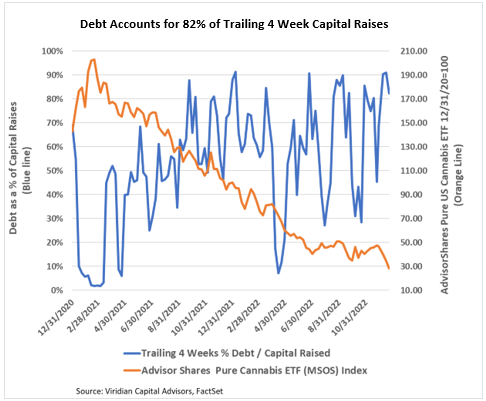
- Debt accounted for 82% of trailing 4-week capital raises. We expect this ratio to be volatile because of the limited capital raise activity. Still, we expect it to average well over 50%, especially since many companies are trading at or close to their 52-week lows.
The Week’s Largest Debt Raise:
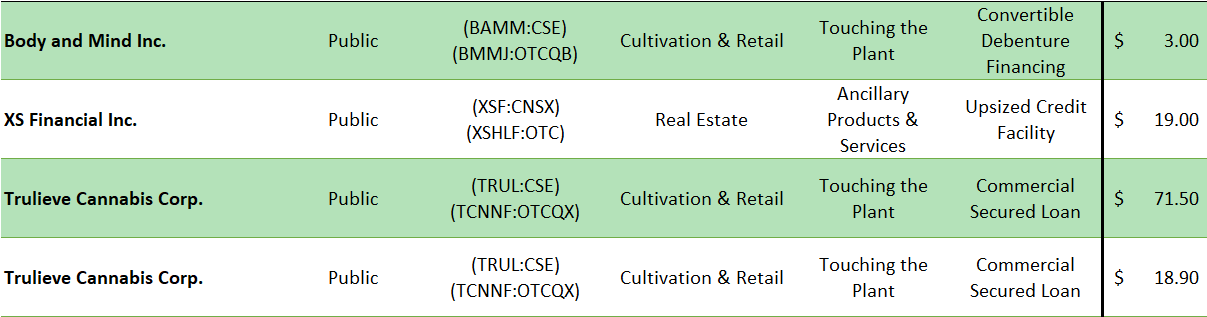
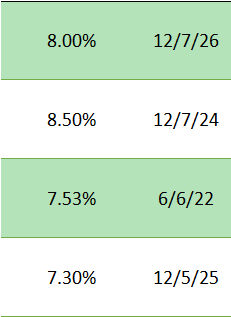
- On December 21st and 22nd, 2022, Trulieve Cannabis (TRUL: CSE)(TCNNF: OTCQX), the third largest MSO by market cap, closed two non-dilutive issues for a total of $90.4M.
- The first transaction was a $71.5M, 5-year loan with a 7.53% rate.
- The loan is secured by a cultivation & processing facility in Florida.
- Valley Bank was the lead lender, joined by two other banks.
- Prepayment terms were not disclosed.
- The second deal was an $18.9M, 10-year loan with a fixed rate of 7.3% for the first five years, resetting to 350 basis points over the five-year Treasury for the remaining term.
- The loan is secured by a cultivation and manufacturing facility in West Virginia.
- The loan is prepayable with cash from operations at any time with no prepayment penalty.
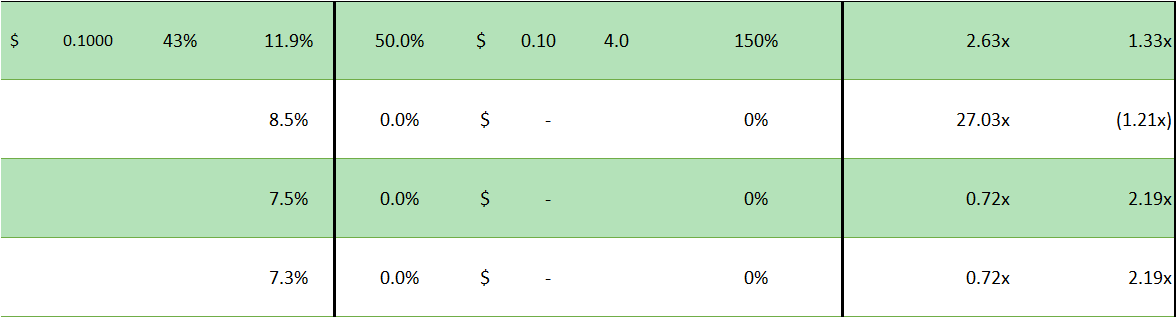
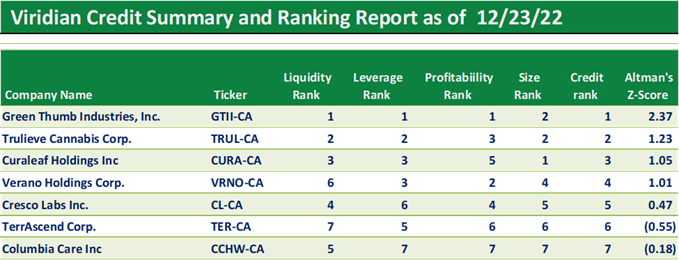
- The Viridian Capital Advisors Credit Tracker model currently ranks Trulieve as the second-best credit in the over $300M market cap U.S. MSO peer group. The company ranks highly in each of our four-factor model elements: Liquidity, Leverage, Profitability, and Size, as shown in the summary table below.
- Despite the company’s top-notch credit quality, we are surprised by the aggressiveness of the pricing of these facilities. Below is a graph showing the spreads to Treasuries of a selection of Tier one MSO debt issuances arranged by date. Trulieve has broken new ground with the 361bp and 374bp spread levels. As reference points, note that the BofA Single B index now trades at a 494bp spread while the BB index trades at a spread of 294bp.
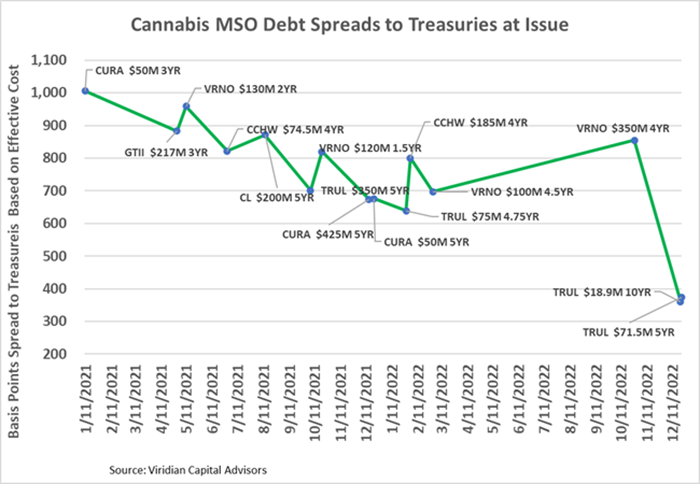
- While we believe that the top few credits in the cannabis landscape may well warrant BB pricing on a legalized, stabilized basis, we find it premature to think that these spreads have become the “new normal” for premier cannabis debt. Instead, we believe that these rates are indicative of banks staking a relationship with a premier operator through aggressive pricing. The five-year loan spreads are even more aggressive given the lack of prepayment penalties (although with rates like these, prepayments may be a less critical consideration).
- Congratulations to Trulieve for providing the industry with a much-needed note of holiday cheer!
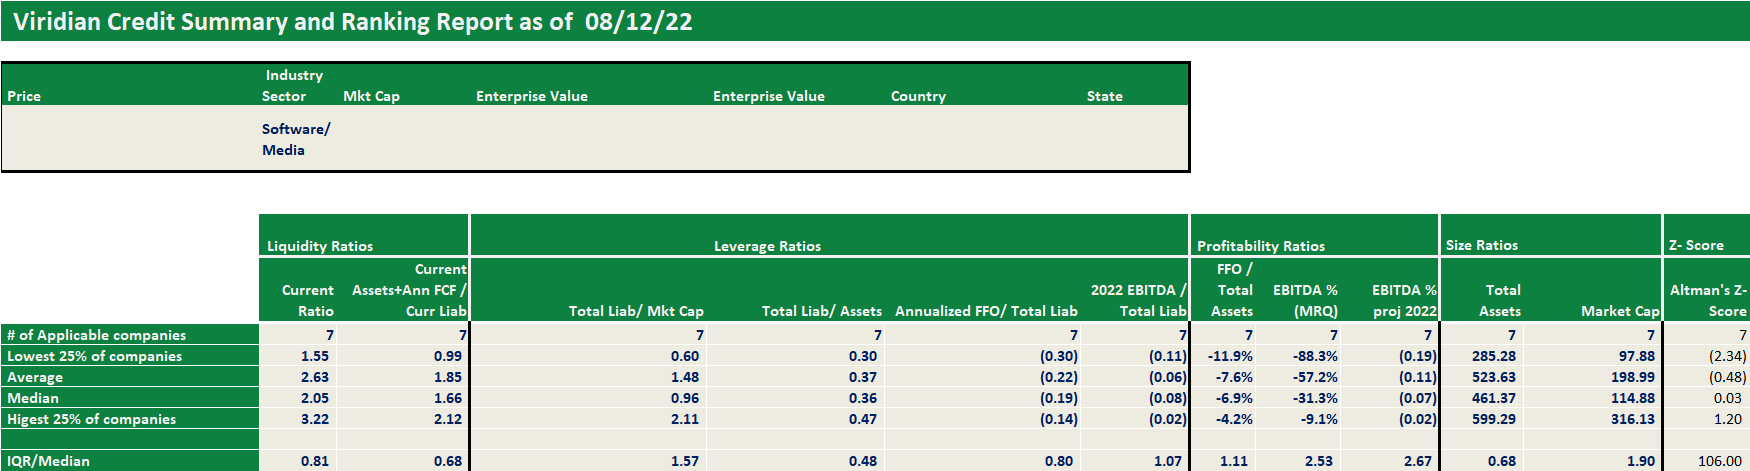
Each week, Viridian highlights a specific industry sector and provides a deep dive into credit metrics and comparable company credit rankings for public companies operating in that sector. Credit ratings are not currently available for public cannabis companies leaving companies, lenders, and investors with a gap of information. The Viridian Cannabis Credit Tracker fills this gap. The model uses 11 market and financial statement variables to discern 4 key credit factors: Liquidity, Leverage, Profitability, and Size, to provide credit/liquidity analysis for over 370 public Cannabis/Hemp companies.
Viridian publishes weekly insights on debt capital raises in the Cannabis/CBD/Psychedelic industries. These insights typically highlight the most interesting/meaningful debt transactions of that week, and commentary on market conditions, debt deal structures, and lenders.