OUR 9TH YEAR OF PROVIDING PROPRIETARY CAPITAL MARKETS INTELLIGENCE ON THE CANNABIS / HEMP / PSYCHEDELIC SECTORS
Viridian publishes weekly data and analysis on debt capital raises in the Cannabis/CBD/Psychedelic industries. This data includes information about the company issuing debt (public/private, state/country location), deal size, deal structure, pricing, warrants, and credit data.


- Debt accounted for 43% of trailing 4-week capital raises, below its LTM average of 61%. Sporadic financing has reduced the correlation between the trailing 4-week debt-to-total financing ratio and equity prices. Still, in the absence of significant positive news regarding SAFE, we expect debt to be the majority of capital raised.

The Week’s Largest Debt Raise:
- On October 12, 2022, TerrAscend (TER: CSE)(TRSSF: OTCQX), the seventh largest U.S. MSO by market cap, closed a $45.5M loan with Pelorus Equity Group.
- The loan has a five-year maturity and is priced at approximately 970bp over the Secured Overnight Financing Rate (SOFR), given its current stated rate of 12.77% and the SOFR rate of 3.04% on the closing date.
- The collateral package includes the company’s real estate assets in New Jersey and Maryland.
- Prepayment provisions include a minimum earned interest period of 36 months, making the loan very expensive to prepay during the first two years.
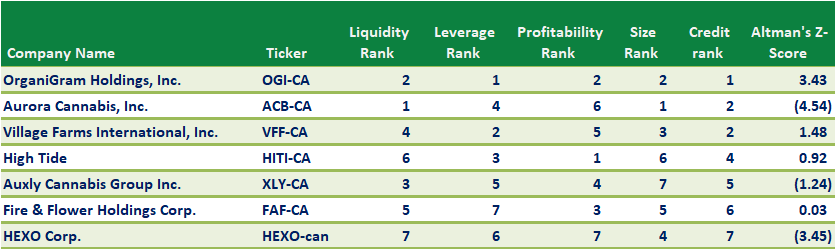
- The chart below shows the Viridian Capital Advisors Credit Tracker rankings of the ten U.S. MSOs with market caps over $300M. TerrAscend ranks number six based on its median leverage ranking, lower than median liquidity, and low profitability ratings.
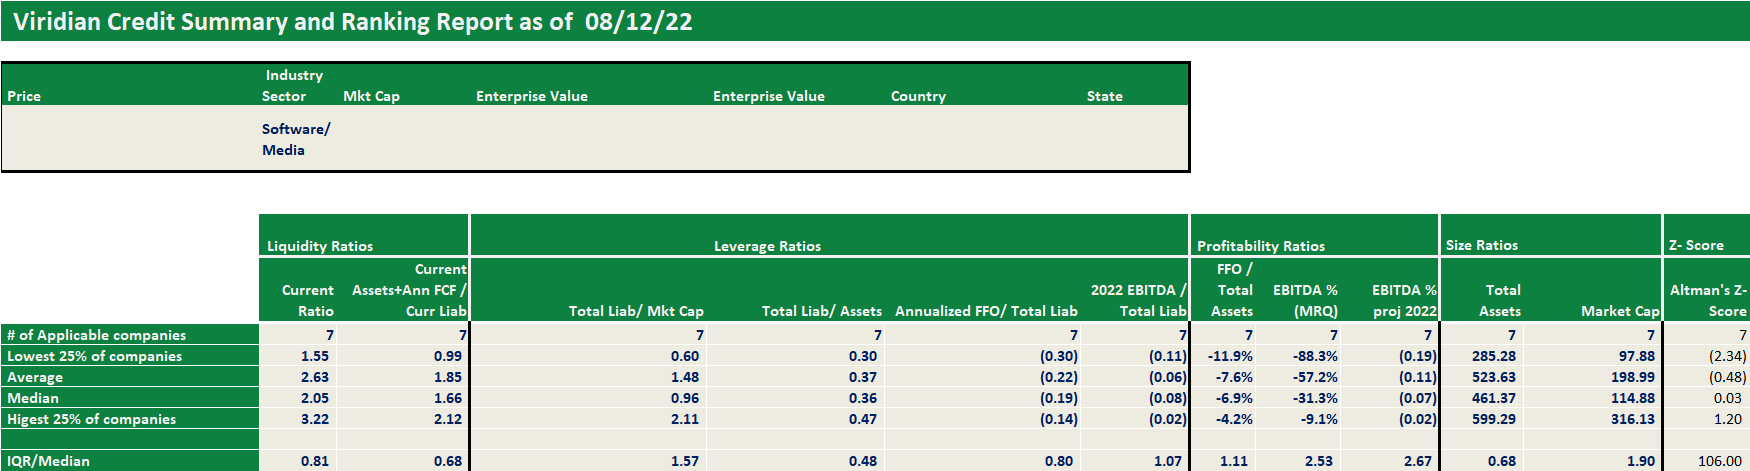
Each week, Viridian highlights a specific industry sector and provides a deep dive into credit metrics and comparable company credit rankings for public companies operating in that sector. Credit ratings are not currently available for public cannabis companies leaving companies, lenders, and investors with a gap of information. The Viridian Cannabis Credit Tracker fills this gap. The model uses 11 market and financial statement variables to discern 4 key credit factors: Liquidity, Leverage, Profitability, and Size, to provide credit/liquidity analysis for over 370 public Cannabis/Hemp companies.
Viridian publishes weekly insights on debt capital raises in the Cannabis/CBD/Psychedelic industries. These insights typically highlight the most interesting/meaningful debt transactions of that week, and commentary on market conditions, debt deal structures, and lenders.