OUR 9TH YEAR OF PROVIDING PROPRIETARY CAPITAL MARKETS INTELLIGENCE ON THE CANNABIS / HEMP / PSYCHEDELIC SECTORS
Viridian publishes weekly data and analysis on debt capital raises in the Cannabis/CBD/Psychedelic industries. This data includes information about the company issuing debt (public/private, state/country location), deal size, deal structure, pricing, warrants, and credit data.


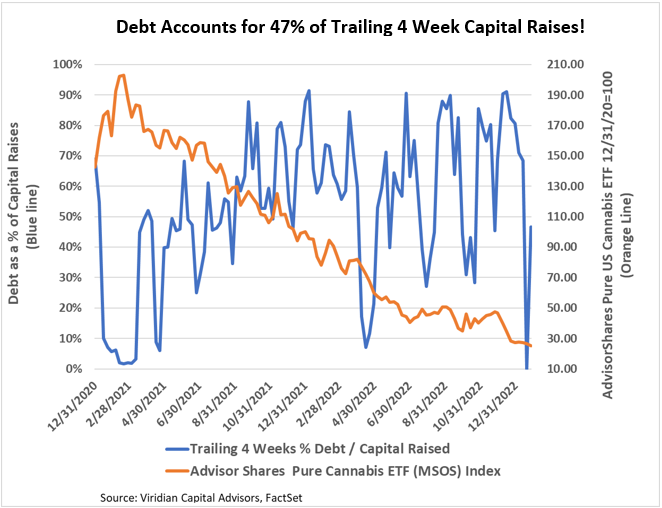
- Debt accounted for 47% of trailing 4-week capital raises. We expect this ratio to be volatile because of the limited capital raise activity. Debt should average over 50% of capital raised, especially since many companies are trading at or close to their 52-week lows. As exemplified by this week’s MariMed raise, we expect more equity-linked transactions in the current capital-constrained climate.
The Week’s Largest Debt Raise:
-
- On January 24, 2023, MariMed (MRMD: CSE)(MRMD: OTC), the 13th largest MSO by market cap, closed a $30M secured credit facility from lenders led by Chicago Atlantic Credit and including Silver Spike Investment Corp.
- An additional $5M of proceeds is available at the Company’s option for six months after the initial closing. According to the agreement, the aggregate commitment may be increased to $65M under certain conditions; however, we could not access the relevant exhibit that appears not to have been filed.
- Proceeds from the Credit Agreement will be used to complete the build-out of a new cultivation and processing facility in Illinois, complete the build-out of a new processing kitchen in Missouri, expand existing cultivation and processing facilities in Massachusetts and Maryland, fund certain capital expenditures, and to repay in full the Kind Therapeutics seller notes incurred in connection with the Kind acquisition in April 2022. The remaining balance, if any, will be used to fund acquisitions.
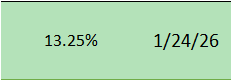
- The cash interest rate is floating at prime + 5.75% with a prime floor of 6.25%. Prime is now 7.5% producing a total cash interest rate of 13.25%.
- An additional 1.4% of PIK interest will also be charged, and this PIK interest rate goes up to 1.75% if the agreement’s maturity is extended.
- The agreement provides for 30% warrant coverage at a 20% premium to the 20-day VWAP. At the initial closing, 19.15M warrants were issued at $0.47 per share exercise price with a five-year expiry.
- The facility requires principal amortization of 1% of the principal outstanding per month beginning in May 2023 and has a final maturity of January 24, 2026, subject to an additional two-year extension under certain circumstances.
- Prepayments under the loan are subject to a “make-whole” for the first 20 months of the term, and subsequently, the company can prepay the facility with a 3% prepayment premium. The 20-month make-whole provision essentially makes the loan uneconomic to prepay for at least the first year, but the 3% premium after month 20 is quite reasonable.
- The loan is secured by substantially all of the company’s assets, with some exclusions for parcels of real estate already collateralized by existing mortgage debt and certain other customary exclusions
- We calculate the effective cost of this facility at 19.7%. To arrive at this figure, we explicitly valued the warrants in the transaction at approximately $2.0M. We use 30% volatility in these calculations because the market is unwilling to ascribe full volatility to cannabis warrants due to the high cost of borrow on the stocks. Importantly, our estimates do not include any fees customary for a facility of this type, such as collateral monitoring fees, success fees on exit, etc. These could add several points of additional effective cost.
- The pricing of this loan is evidence of the recent tightening of credit conditions in the cannabis market. Debt is becoming more expensive and more challenging to access. At the same time, MariMed and other companies have attractive IRR projects to fund that warrant paying the higher cost.
- The cash interest expense of 13.25% is only 2/3 of the total cost, but it represents a spread over treasuries of 938 bp. That puts this loan close to the classic definition of distressed at 1000bp over treasuries.
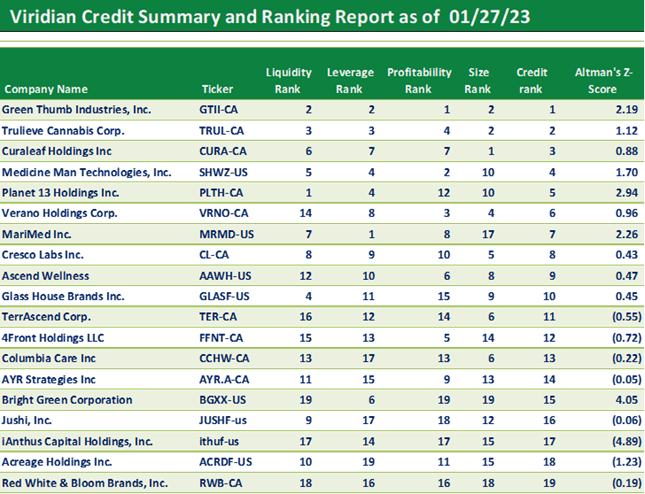
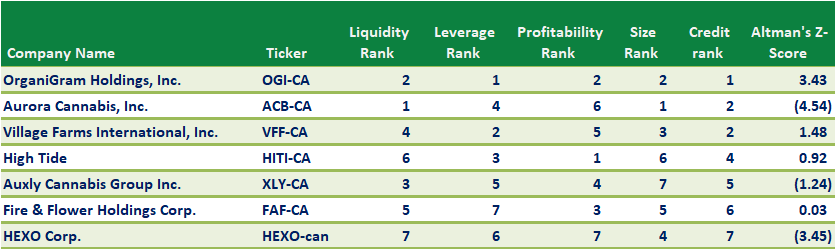
- We consider MariMed to be an excellent credit. The table below shows the Viridian Credit Tracker model rankings for the 19 MSOs with market caps over $50M. MariMed ranks as the 7th best credit, ahead of several much larger companies like Cresco (CL: CSE), Ascend (AAWH: OTC), Columbia Care (CCWH: CSE), and AYR (AYR.A: CSE). MariMed’s ranking would be higher still, but the Virdian model penalizes it for its relatively small size.
- On January 24, 2023, MariMed (MRMD: CSE)(MRMD: OTC), the 13th largest MSO by market cap, closed a $30M secured credit facility from lenders led by Chicago Atlantic Credit and including Silver Spike Investment Corp.
-
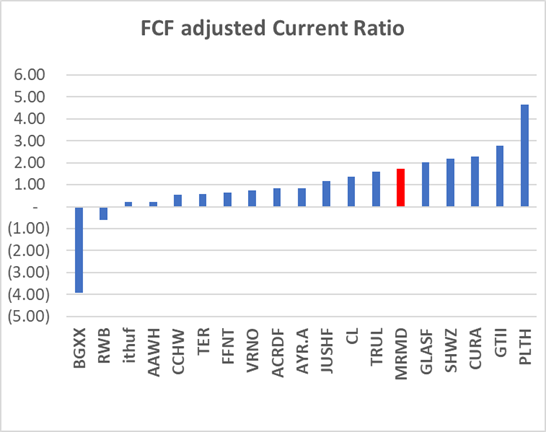
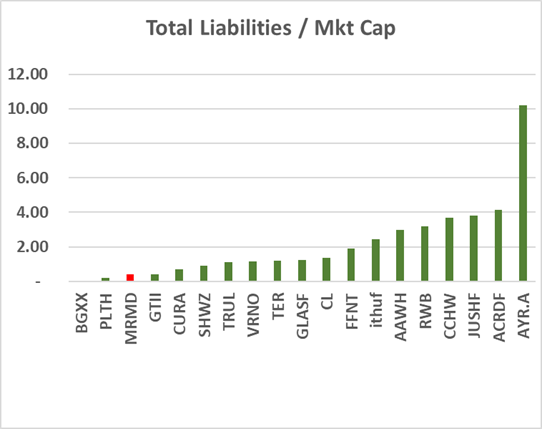
- The Viridian Credit Tracker model uses 11 variables to estimate four main credit factors: liquidity, leverage, profitability, and size. The graphs below use our most highly weighted liquidity and leverage ratios to demonstrate the strength of the MariMed credit. The free cash flow adjusted current ratio takes the standard current ratio and adds annualized free cash flow to the numerator, accounting for cash burn and short-term debt maturities. The total liabilities/market cap ratio is our favorite measure of leverage, giving a market-based estimate of the value of assets above liabilities.
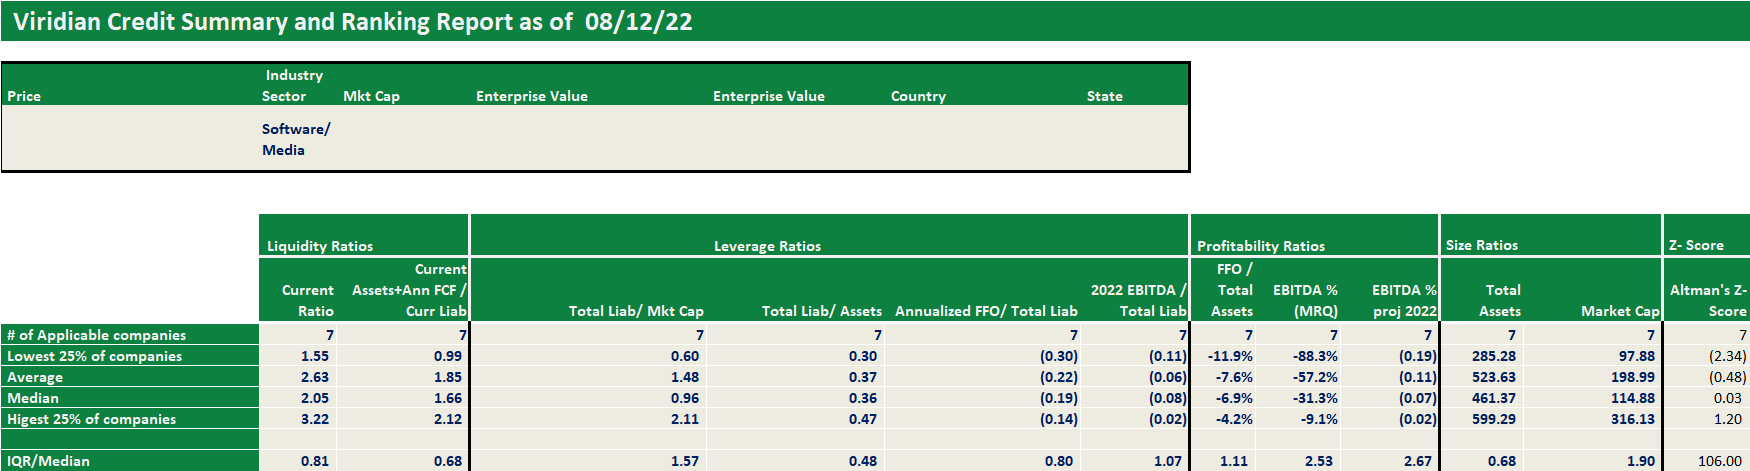
Each week, Viridian highlights a specific industry sector and provides a deep dive into credit metrics and comparable company credit rankings for public companies operating in that sector. Credit ratings are not currently available for public cannabis companies leaving companies, lenders, and investors with a gap of information. The Viridian Cannabis Credit Tracker fills this gap. The model uses 11 market and financial statement variables to discern 4 key credit factors: Liquidity, Leverage, Profitability, and Size, to provide credit/liquidity analysis for over 370 public Cannabis/Hemp companies.
Viridian publishes weekly insights on debt capital raises in the Cannabis/CBD/Psychedelic industries. These insights typically highlight the most interesting/meaningful debt transactions of that week, and commentary on market conditions, debt deal structures, and lenders.