OUR 9TH YEAR OF PROVIDING PROPRIETARY CAPITAL MARKETS INTELLIGENCE ON THE CANNABIS / HEMP / PSYCHEDELIC SECTORS

Credit Tracker By Industry Sector

Credit Tracker By Sector

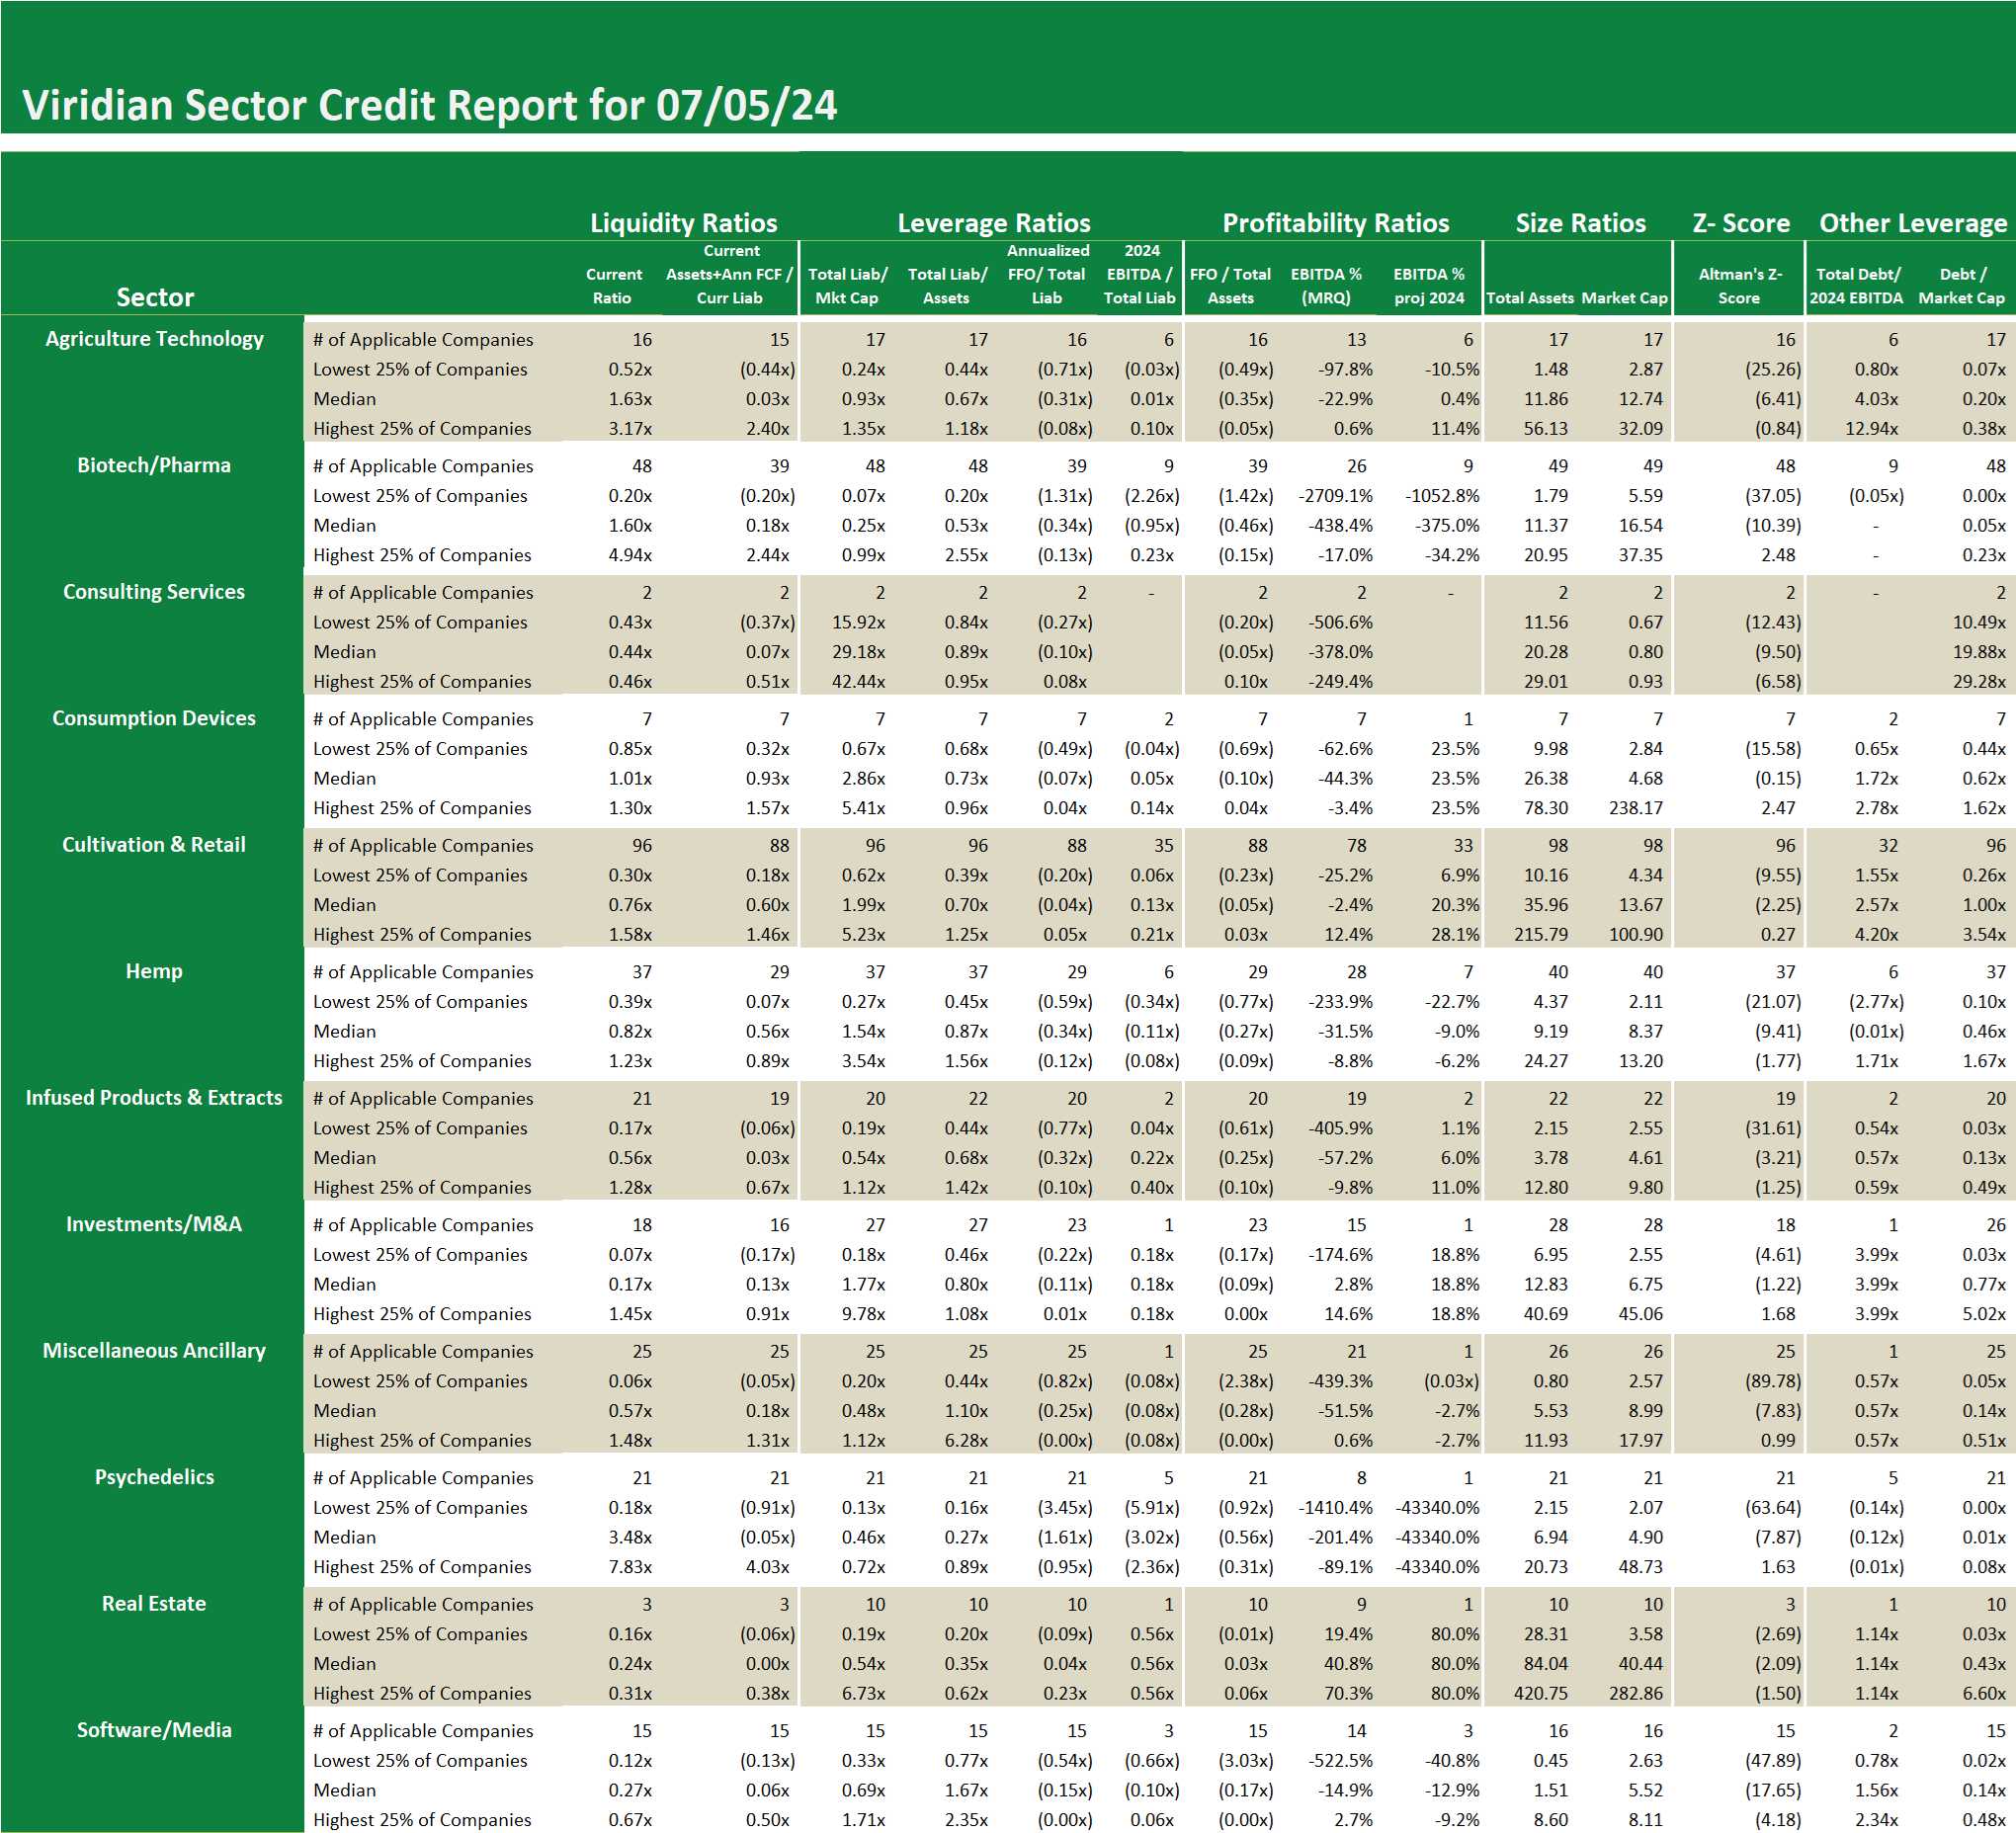
Credit ratings are not currently available for public cannabis companies leaving companies, lenders and investors with a gap of information. The Viridian Cannabis Credit Tracker fills this gap. The model uses 11 market and financial statement variables to discern 4 key credit factors: Liquidity, Leverage, Profitability, and Size, to provide credit/liquidity analysis for over 370 public Cannabis/Hemp companies.

Week ended 07/05/2024

Weekly Sector Credit

  • This week’s Credit Sector Tracker profiles the 96 companies in the Cultivation and Retail segment. We have added around 50 new companies to our database, and this has expanded the number of cultivation sectors from 83 to 96.
  • Accordingly, this report established a new set of benchmarks for the sector.
  • Liquidity measures for the group have not changed substantially. The median free cash flow adjusted current ratio is now .60x, indicating that more than ½ of the companies will need to complete financings during the next twelve months. More encouraging is the fact that the 3rd quartile number of 1.46x says that at least ¼ of the companies have adequate liquidity.
  • The median leverage, as indicated by the total liabilities to market cap statistic, has come down markedly when we include the new companies. The median number of 1.99x compares quite favorably with the 2.76x for the smaller group of 82 vs 96 now.
  • Sell-side analysts cover the same thirty-two companies in the augmented list as in the previous list. Accordingly, the median Debt/ 2024 EBITDA of 2.57x has not changed significantly.
  • The equity pricing has generally declined over the last several weeks, pushing up market leverage. We expect this to come down as the market becomes more confident about the timing of S3.

This Chart is Only Available to Higher Tier Memberships

Please Purchase a Premium or Enterprise membership to see more.