OUR 9TH YEAR OF PROVIDING PROPRIETARY CAPITAL MARKETS INTELLIGENCE ON THE CANNABIS / HEMP / PSYCHEDELIC SECTORS
Credit ratings are not currently available for public cannabis companies leaving companies, lenders and investors with a gap of information. The Viridian Cannabis Credit Tracker fills this gap. The model uses 11 market and financial statement variables to discern 4 key credit factors: Liquidity, Leverage, Profitability, and Size, to provide credit/liquidity analysis for over 370 public Cannabis/Hemp companies.
The 93 companies in the cultivation and retail sector are clearly showing some signs of stress. The median free cash flow adjusted current ratio is .68x, indicating that more than half of the companies need more financing to get through the year.
Similarly, the median Debt/2024 EBITDA for the 33 companies in the group with analyst coverage is 2.87x, a level that is unsustainable in a 280e world.
The analysis is simple: imagine a company with $1 of revenue, 50% gross margins, and 20% SG&A to produce 30% EBITDA margins. The company’s combined federal and state tax bill under 280e will be 26% x $0.50 or $0.13. Assuming the company has 3x debt to EBITDA and its debt averages 12%, its interest expense will be 3*.3*.12=$0.108 So what will its free cash flow be, Ignoring CAPEX or Working Capital?
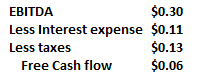
With a free cash flow of .062 and a debt of 3x EBITDA=$.90, the company’s debt payback period will be 14.5 years!! And remember, this does not count CAPEX or growth in working capital. That is not a bankable proposition. The industry clearly needs to delever. Suppose we run the exact numbers but assume 280e is gone. Taxes would drop to about $.03, assuming that interest, depreciation, and SG&A are all tax deductible. The debt payback period drops to 5.5 years, which is better but still on the edge of acceptable.
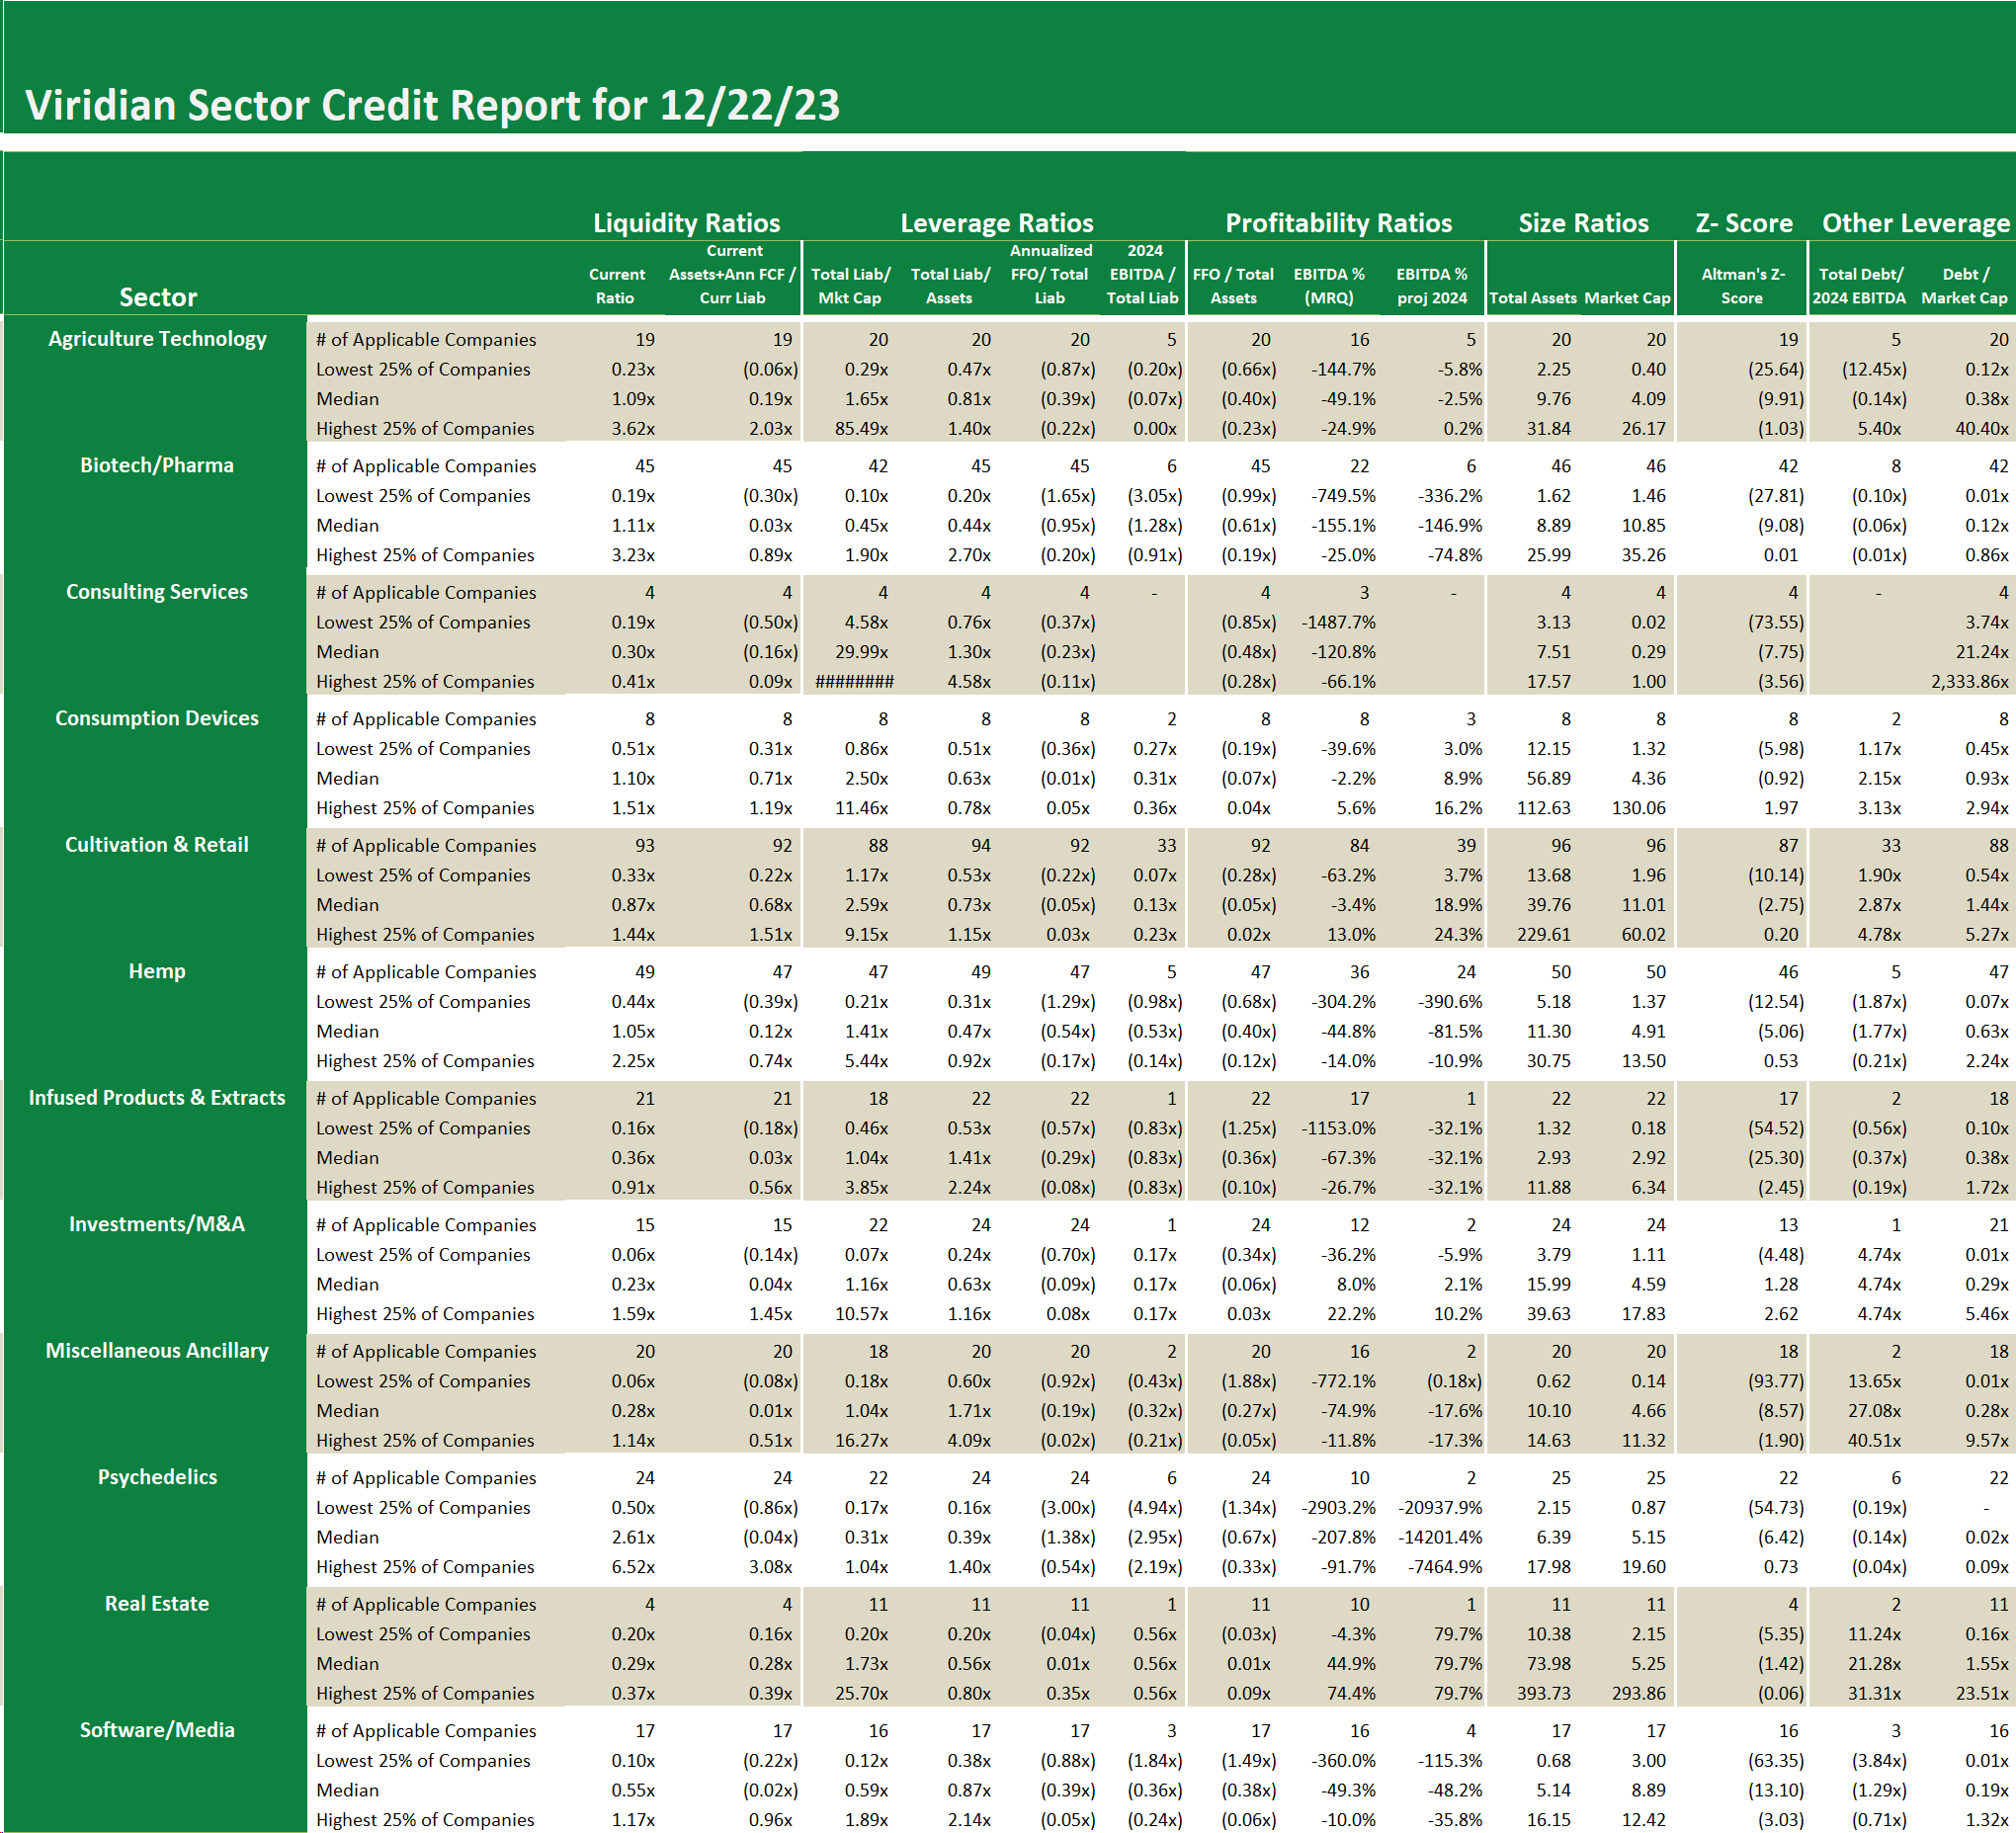
The 93 companies in the cultivation and retail sector are clearly showing some signs of stress. The median free cash flow adjusted current ratio is .68x, indicating that more than half of the companies need more financing to get through the year.
Similarly, the median Debt/2024 EBITDA for the 33 companies in the group with analyst coverage is 2.87x, a level that is unsustainable in a 280e world.
The analysis is simple: imagine a company with $1 of revenue, 50% gross margins, and 20% SG&A to produce 30% EBITDA margins. The company’s combined federal and state tax bill under 280e will be 26% x $0.50 or $0.13. Assuming the company has 3x debt to EBITDA and its debt averages 12%, its interest expense will be 3*.3*.12=$0.108 So what will its free cash flow be, Ignoring CAPEX or Working Capital?
With a free cash flow of .062 and a debt of 3x EBITDA=$.90, the company’s debt payback period will be 14.5 years!! And remember, this does not count CAPEX or growth in working capital. That is not a bankable proposition. The industry clearly needs to delever. Suppose we run the exact numbers but assume 280e is gone. Taxes would drop to about $.03, assuming that interest, depreciation, and SG&A are all tax deductible. The debt payback period drops to 5.5 years, which is better but still on the edge of acceptable.