Credit ratings are not currently available for public cannabis companies leaving companies, lenders and investors with a gap of information. The Viridian Cannabis Credit Tracker fills this gap. The model uses 11 market and financial statement variables to discern 4 key credit factors: Liquidity, Leverage, Profitability, and Size, to provide credit/liquidity analysis for over 370 public Cannabis/Hemp companies.
Weekly Credit Report – US Cultivation and Retail Sector Net Working Asset Efficiency
-
- Cannabis has undergone several stages of evolution in how companies are measured and rewarded by investors.
- We are at a new turning point. Investors and companies alike will increasingly be focused on Return on Invested Capital (ROIC). A company can be EBITDA-positive and even free cash flow-positive, but if it has required too large a pool of investor cash to achieve these goals, it is still a financial failure.
- We can divide the ROIC formula into two multiplicative terms: profitability, measured as after-tax operating income to revenues, and capital efficiency, measured as revenues per invested capital.
- We can further break down capital efficiency into two parts. Fixed asset utilization measures how productively a company uses its fixed assets to generate sales. Working capital efficiency measures how much net working assets a company requires to create a dollar of sales.
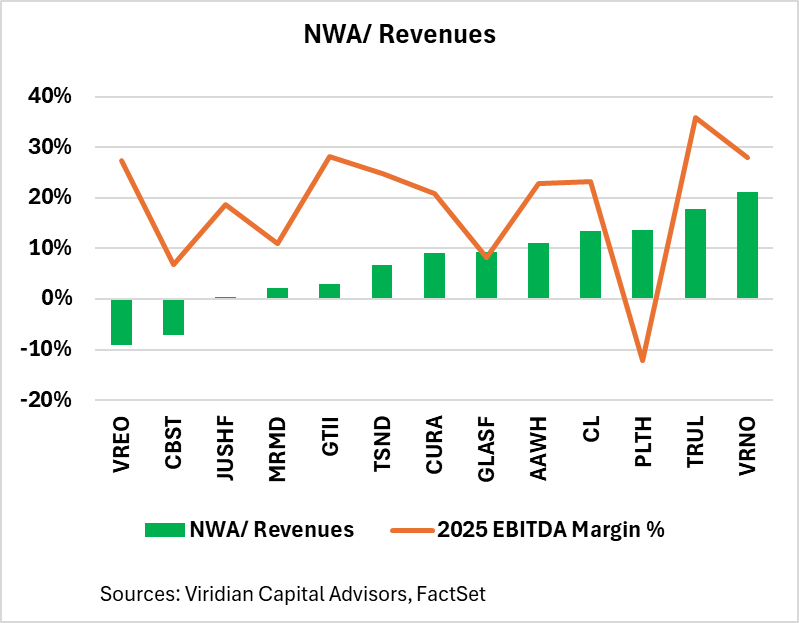
- The chart below examines the net working assets/sales ratios for 13 MSOs. We used the most recent quarterly numbers to calculate net working assets as (current assets – Cash) – (Current Liabilities – Current debt and current maturities of LTD). This takes into account the full picture of how much capital is required in working assets to generate a dollar of sales. We used the 3rd quarter balance sheets for the working capital figures and consensus 2025 revenues for the denominator of the ratio. If a company has a 10% ratio, it indicates that for each extra dollar of sales, the company will require $.10 of incremental working capital. This, therefore, becomes a measure of the working capital “drag” on growth. If a company has a higher NWA/Sales than its EBITDA margin, then each incremental dollar of sales will require outside financing.
- The chart below shows a wide variation in working capital productivity. If a company consistently has a negative figure, it means that it can maintain high enough payables and accrued expenses, such that growth is actually self-financing. Investors should compare the NWA/Revenues to the EBITDA Margin to identify which companies may require external financing to fund working capital growth. Companies, like Planet 13, with lower EBITDA margins (in this case, negative) relative to their NWA/Revenues will require external financing to support growth.
Credit ratings are not currently available for public cannabis companies leaving companies, lenders and investors with a gap of information. The Viridian Cannabis Credit Tracker fills this gap. The model uses 11 market and financial statement variables to discern 4 key credit factors: Liquidity, Leverage, Profitability, and Size, to provide credit/liquidity analysis for over 370 public Cannabis/Hemp companies.
Weekly Sector Credit – US Cultivation and Retail Sector Net Working Asset Efficiency
-
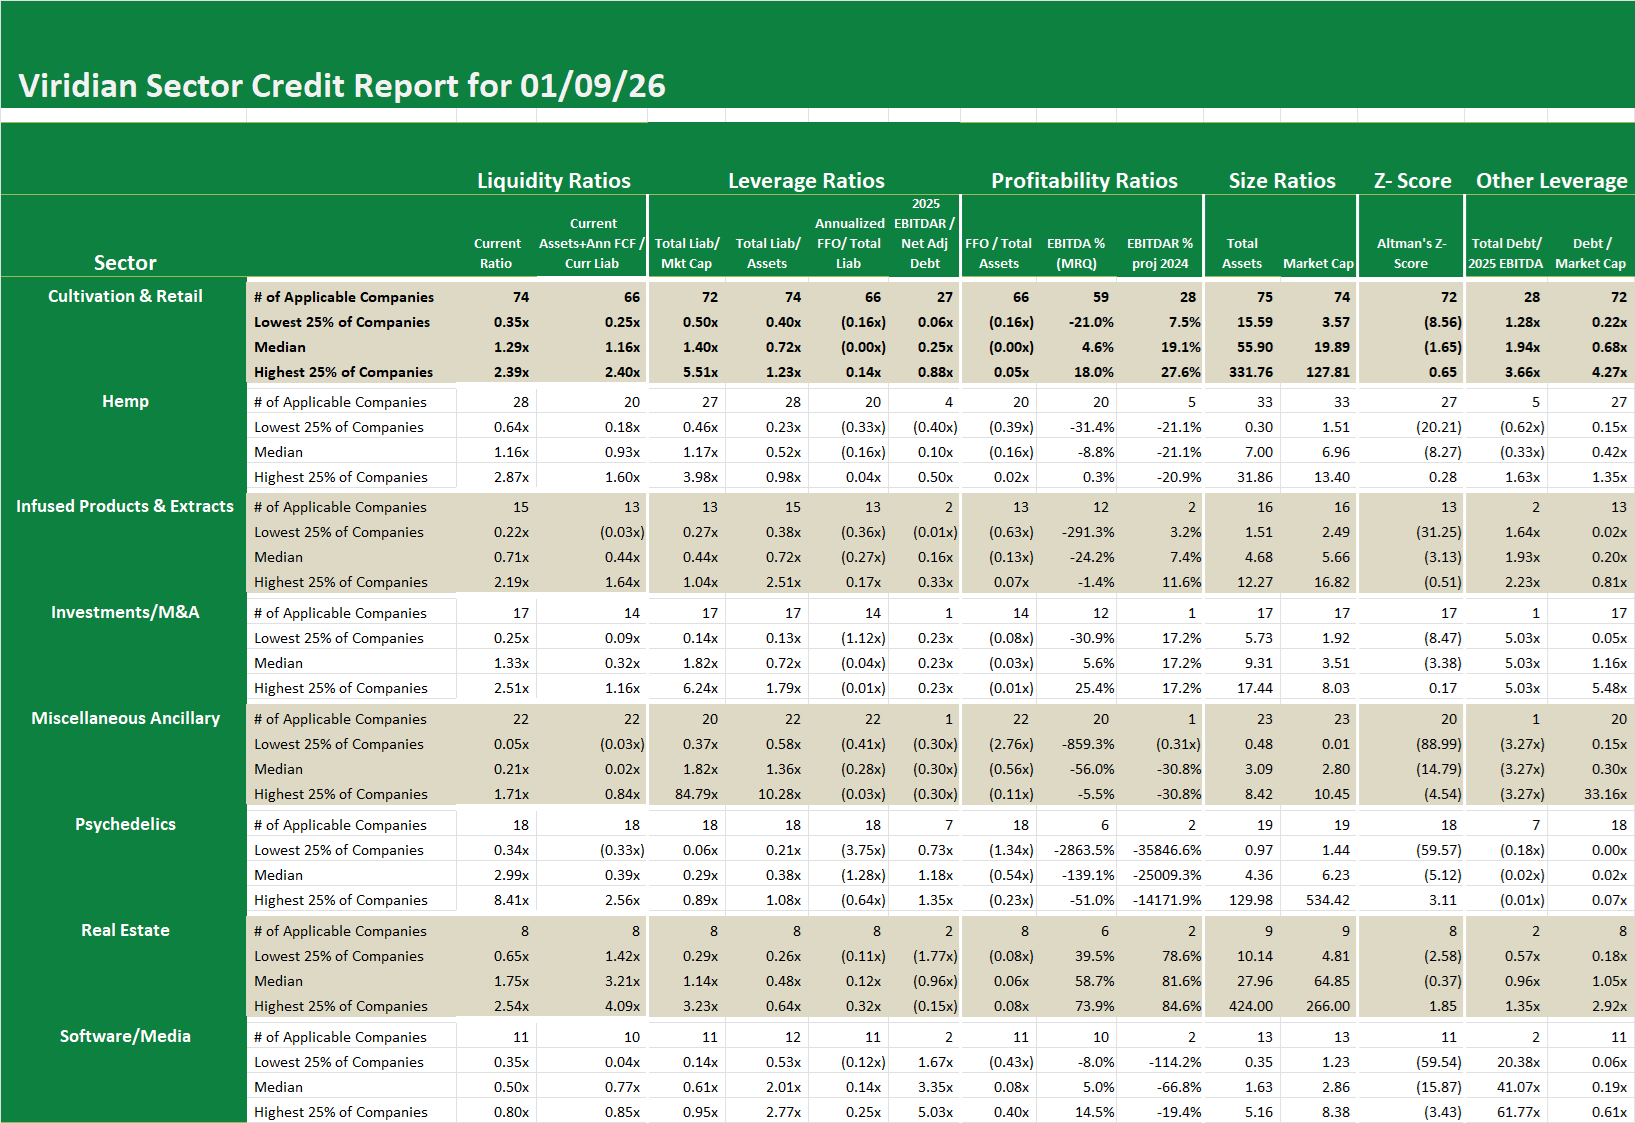
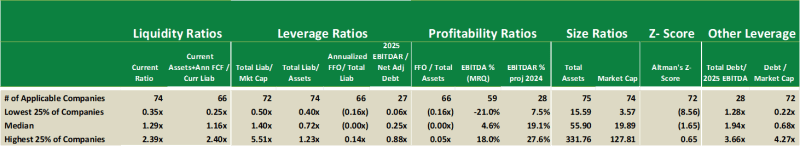
- The free cash flow-adjusted current ratio median of 1.16x indicates that more than ½ of the companies in the sector have sufficient liquidity (considering cash generation or burn) to meet their current liabilities over the course of the year.
- The median total liabilities-to-market cap of 1.4x shows strong asset value coverage of liabilities for at least half of the sector participants. However, the 5.51x third quartile figure shows that at least ¼ of the 72 companies are operating as out of the money options, with current asset value less than liabilities.
- The median market cap of $19.89M indicates that most companies in this sector are quite small. Arguably, more than half of the companies in this sector are too small to justify being public companies. Public company expenses often exceed $2M annually, which is a heavy drag on a $20M market cap company.
- The 0.00x funds from operations to total liabilities show that only the top 50% of companies are cash flow positive after tax.
Weekly Sector Credit – US Cultivation and Retail Sector Net Working Asset Efficiency
-
- The free cash flow-adjusted current ratio median of 1.16x indicates that more than ½ of the companies in the sector have sufficient liquidity (considering cash generation or burn) to meet their current liabilities over the course of the year.
- The median total liabilities-to-market cap of 1.4x shows strong asset value coverage of liabilities for at least half of the sector participants. However, the 5.51x third quartile figure shows that at least ¼ of the 72 companies are operating as out of the money options, with current asset value less than liabilities.
- The median market cap of $19.89M indicates that most companies in this sector are quite small. Arguably, more than half of the companies in this sector are too small to justify being public companies. Public company expenses often exceed $2M annually, which is a heavy drag on a $20M market cap company.
- The 0.00x funds from operations to total liabilities show that only the top 50% of companies are cash flow positive after tax.