OUR 9TH YEAR OF PROVIDING PROPRIETARY CAPITAL MARKETS INTELLIGENCE ON THE CANNABIS / HEMP / PSYCHEDELIC SECTORS
Quick
Links
Past Charts
Home » Viridian Capital Chart of the Week: Who Has the Strongest Working Capital Position?
Chart of the Week
Chart of the Week
The Viridian Capital Chart of the Week highlights key investment, valuation and M&A trends taken from that week’s Deal Tracker that we believe are impactful for investors, companies and acquirers.
Week ended 09/29/2023
Viridian Capital Chart of the Week: Who Has the Strongest Working Capital Position?
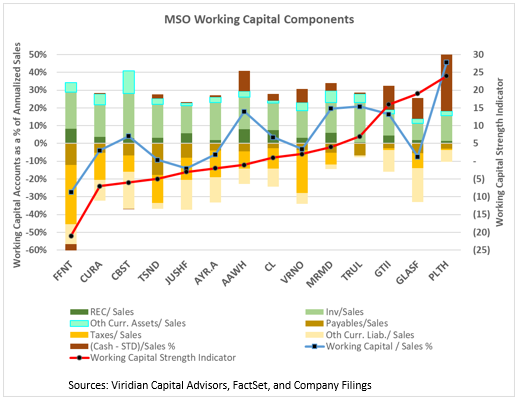
- The fourteen MSOs in the graph have all worked hard over the last year to lean down their working capital usage in order to increase operating cash flow.
- The chart looks at the components of working capital as of June 30, 2023, adjusted for subsequent capital markets transactions. Current assets are broken down into net cash (cash minus short-term debt and current maturities), receivables, inventory, and other current assets. These items are depicted as positive percentages of annualized sales and are measured on the left axis. Current liabilities, shown as negative percentages of annualized sales, are broken into accounts payable, accrued taxes, and other current liabilities.
- The blue line depicts working capital as a percentage of sales, ranging from negative 28% for 4Front (FFNT: CSE) to 46% for Planet 13 (PLTH: CSE). This ratio, or perhaps the raw dollar equivalent, is the most frequent way to show working capital strength; however, this misses the nuances of the various working capital categories. For example, net cash is preferable to inventories, and accounts payable is preferable to accrued taxes.
- Receivables (dark green bars) range from about 0.7% of sales (2.5 days of sales) for Trulieve (TRUL: CSE) to around 8.3% (30 days) for 4Front. Receivables have become an issue in cannabis due to the relatively low credit quality of the payors.
- Inventories, (olive green bars) are still quite high for the group. They range from a low of 67 days of COGS for Glass House (GLASF: OTCQX) to a high of 183 days for Cannabist (CBST). MSOs have been working to trim inventories at the cost of lower gross margins.
- Net cash (cash minus STD) (maroon bars) ranges from negative 5% of sales for 4Front to 38% of sales for Planet 13.
- Accrued taxes range from 0% of sales for Trulieve to nearly 34% for 4Front.
- Viridian constructed an indicator of working capital strength by ranking the attractiveness of the categories. Net cash is ranked from -6 for the lowest company to 7 for the highest. Receivables, Inventory, and accrued taxes are ranked from -6 for the highest company to 7 for the lowest. The working capital indicator shown in red sums the rankings on each measure and is measured on the right axis.
- 4Front ranks as having the weakest working capital position. It has negative net cash, the highest receivables, and accrued taxes, and the third-highest days of inventory. Curaleaf (CURA: CSE) and Cannabist (CBST: NEO) both have low net cash and either high accrued taxes (CURA) or high inventory (CBST).
- The top three companies, Green Thumb (GTII: CSE), Glass House (GLASF: OTCQX), and Planet 13 (PLTH: CSE), all have strong net cash positions, moderate inventories, and low accrued taxes.
- A dollar of working capital is not all the same. It matters what the composition is. And, although working capital is just one aspect of credit quality, investors should pay careful attention to each company’s working capital composition.