OUR 9TH YEAR OF PROVIDING PROPRIETARY CAPITAL MARKETS INTELLIGENCE ON THE CANNABIS / HEMP / PSYCHEDELIC SECTORS
Quick
Links
Past Charts
Home » Viridian Capital Chart of the Week: Who Are the Strongest MSO Credits and How Are They Trending?
Chart of the Week
Chart of the Week
The Viridian Capital Chart of the Week highlights key investment, valuation and M&A trends taken from that week’s Deal Tracker that we believe are impactful for investors, companies and acquirers.
Week ended 12/08/2023
Viridian Capital Chart of the Week: Who Are the Strongest MSO Credits and How Are They Trending?
- The Viridian Credit Tracker model is a valuable tool for investors and companies alike to gauge the credit quality of cannabis companies. The model utilizes 11 market-based and financial statement-based variables to measure four critical attributes of credit quality: Liquidity, Leverage, Profitability, and Size.
- Credit quality is not a constant; market conditions and management decisions can influence it. Aggregate credit quality in cannabis has declined over the last year for several reasons. As both the availability and attractiveness of equity funding have fallen, companies have turned to debt financing for growth capital and to support cash flow shortfalls, resulting in several MSOs becoming overly leveraged. Rising market interest rates exacerbate the issue.
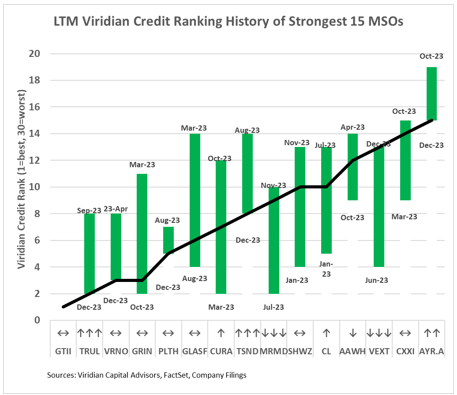
- The Chart of the Week shows the current Viridian Credit Model ranking (black line) for the strongest 15 MSOs and where their rankings have been over the last twelve months. The bottom of the green bar shows the best ranking that the company has achieved in the previous twelve months and the most recent date that the company had that rank. The top of the green bar shows the worst ranking and the most recent date the company had that rank. The arrows above the ticker symbol indicate the trend over the last three months, with three up arrows indicating substantial improvement.
- The companies that have improved the most over the last three months:
- Trulieve has improved significantly from the # 8 ranking in August to #2 currently. The company beat expectations on free cash flow in the 3rd quarter and used its cash to call its 9.75% bonds set to mature in 2023. The company has exited unprofitable markets in Arizona and Massachusetts and will gain handsomely if Florida goes rec.
- TerrAscend has improved from 14th position in August to 8th currently. TerrAscend has dramatically improved its profitability and is now 14th ranked compared to 23rd in August. Funds from operation / total liabilities, one of our key leverage indicators, has improved from 26th place to 14th place. TSND’s solid position in Maryland helped on both points.
- Companies that have deteriorated the most over the last three months:
- MariMed has declined from #2 in July to #9 currently. It missed its 3rd quarter consensus EBITDA estimates by a wide margin and has gone from 4th to 9th on leverage and from 7th to 13th on profitability. Still, we are big believers in the company’s strategy, management, and positioning and look forward to seeing them improve their ranking.
- Vext has declined from 4th rank in June to #13 currently. Like MariMed, Vext seriously missed its 3rd quarter EBITDA estimates, and its Profitability ranking has drastically reduced from #3 to #24. Still, the company enjoys strong liquidity and better-than-average leverage. Declines in the Arizona market have hurt the company.
- Companies that manage cash flow and credit quality by extending or paying off maturing debt, tightening working capital, exiting unprofitable markets, and utilizing pockets of equity market strength to raise equity selectively, will be best positioned to benefit from the market upswing when rescheduling arrives.