OUR 9TH YEAR OF PROVIDING PROPRIETARY CAPITAL MARKETS INTELLIGENCE ON THE CANNABIS / HEMP / PSYCHEDELIC SECTORS
Quick
Links
Past Charts
Home » Viridian Capital Chart of the Week: Which Cannabis Companies Are Most Attractive Now?
Chart of the Week
Chart of the Week
The Viridian Capital Chart of the Week highlights key investment, valuation and M&A trends taken from that week’s Deal Tracker that we believe are impactful for investors, companies and acquirers.
Week ended 01/03/2025
Viridian Capital Chart of the Week: Which Cannabis Companies Are Most Attractive Now?
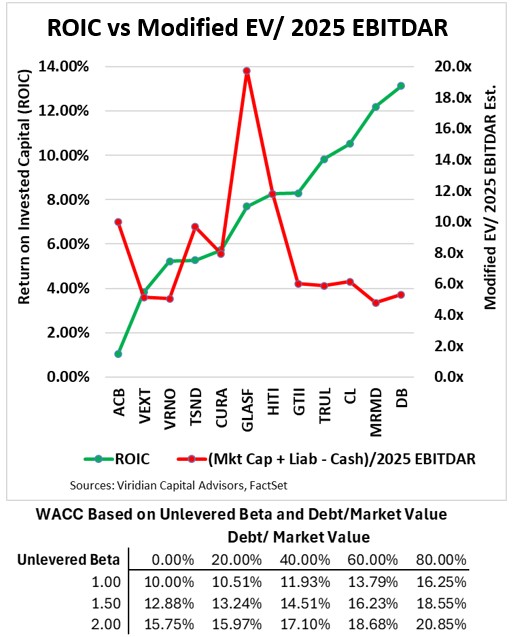
- Viridian’s Chart of the Week looks at the profitability of U.S. and Canadian Cannabis companies as measured by their 2025 Projected Return on Invested Capital (ROIC) (depicted by the green line) compared to their valuation multiple as represented by (Market Cap. + Total Liabilities – Cash) / 2025 Est. EBITDAR (shown by the red line).
- We started with a list of 50 U.S. and Canadian cannabis companies that included all of the largest market cap companies in each jurisdiction. We used several criteria to reduce the set to the twelve companies on the chart:
- We calculated the market implied asset coverage of liabilities and eliminated 20 companies with less than 1x coverage.
- Next, we eliminated 10 companies that had no sell-side analyst coverage.
- Finally, we eliminated eight companies with negative ROIC.
- Our November 29th Chart of the Week explored the ROICs of a number of major US MSOs. We compared the calculated ROICs with a hypothetical table of Weighted Average Costs of Capital (WACC), which we reprinted below the chart. We concluded that most MSOs are not currently earning their cost of capital. Furthermore, we we believe it is not the profitability that is lacking, especially since we assumed that 280e would be eliminated by the end of 2025. Instead, it is the capital intensity that is the issue, and this has to do with the need to operate duplicate operations in multiple state silos.
- Still, several companies on the right side of the chart, including MariMed (MRMD: OTCQX) and Decibel Cannabis (DB: TSX), have achieved ROICs that likely exceed their WACCs.
- Our chosen valuation measure of (market cap + total liabilities – cash) / EBITDAR is the most comprehensive measure we know of. It corresponds to our option valuation methodology of estimating market values of assets.
- The five companies on the right side of the chart have the highest ROICs with the lowest valuation metrics and jump out as the most attractive investment candidates. Some of these, like Green Thumb (GTII: CSE) and Trulieve (TRUL: CSE), are hardly controversial. Cresco (CL: CSE), MariMed (MRMD: OTCQX), and Decibel (DB: TSX) may be more contentious. Cresco has a $400M term loan maturity in August 2026 that may cause investors concern. MariMed and Decibel are both very small-cap, and the knock on them is that they are not likely to be the first beneficiaries of any increased capital flow or market enthusiasm post-280e. One might argue that Verano (VRNO: Cboe) deserves more consideration based on the potential upside from Pennsylvania and its newly acquired position in Virginia. Still, these upsides have not yet been reflected in analyst estimates.
- Investors should utilize the criterion represented on the chart: solid asset value coverage, good profitability, and relatively low valuation multiples, in selecting assets for 2025.