OUR 9TH YEAR OF PROVIDING PROPRIETARY CAPITAL MARKETS INTELLIGENCE ON THE CANNABIS / HEMP / PSYCHEDELIC SECTORS
Quick
Links
Past Charts
Home » Viridian Capital Chart of the Week: Which Cannabis Companies are Best Positioned in the Capital Constrained Market?
Chart of the Week
Chart of the Week
The Viridian Capital Chart of the Week highlights key investment, valuation and M&A trends taken from that week’s Deal Tracker that we believe are impactful for investors, companies and acquirers.
Week ended 04/28/2023
Viridian Capital Chart of the Week: Which Cannabis Companies are Best Positioned in the Capital Constrained Market?
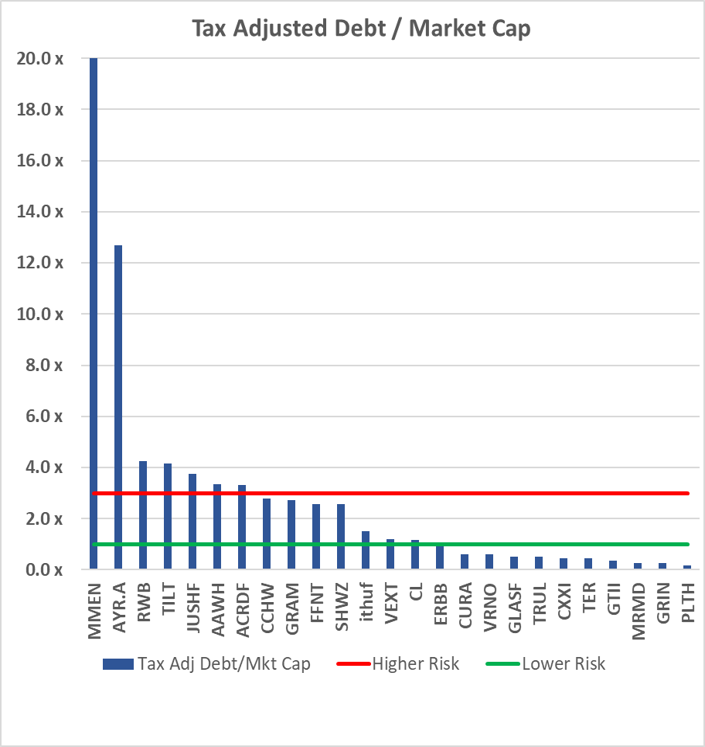
- The chart shows the Tax Adjusted Debt to Market Capitalization of the twenty-four U.S. Cultivation & Retail sector companies in the Viridian Credit Tracker database with market caps above $20M. We have excluded Bright Green (BGXX: Nasdaq) because its pre-revenue, start-up nature renders it less comparable to the other companies.
- The press has reported cannabis companies utilizing unpaid taxes as a source of capital. However, the unrecognized ”debt” is insignificant for most companies on the chart. We would expect any company, cannabis or not, to have significant accrued tax liabilities on its balance sheet. We would assume that these liabilities would grow over time.
- Our benchmark for appropriate accrued tax liabilities is one quarter’s worth of tax expense. Accordingly, we calculated the difference between accrued tax liabilities and the most recent quarter’s current tax expense and added this amount to the debt. Only three companies were significantly impacted: Verano (VRNO: CSE) by $85M, MedMen (MMEN: CSE) by $69M, and 4Front (FFNT: CSE) by $22M.
- Debt / Market Cap is the best one-number indicator of credit quality. Drawing on our High-Yield and Distressed Debt background, we have found that when this statistic rises significantly above 3x, it strongly indicates elevated credit risk. Similarly, we believe that numbers under 1x generally represent reasonable (although not investment grade) credit quality.
- The three highest-risk credits on the chart not only have debt/ market cap significantly over 4x, but they also have significant upcoming debt maturities. MedMen (MMEN: CSE) hired ATB to explore restructuring options centering around its assets in Arizona, Illinois, and Nevada. Red White & Bloom (RWB: CSE) managed to push maturities on over C$100M of debt from 2023 to 2024 and settled an additional $10.5M of debt with common stock but has not made significant strides in actually reducing leverage. AYR (AYR.A) has extreme market leverage and significant maturities in 2024. However, we believe some combination of asset sales and refinancing is still likely. Adjusted Debt represents 5x projected 2023 EBITDA, which we do not find that extreme.
- Tilt Holdings (TILT: NEO) was a bit more successful in pushing out around $45M of maturities to 2026 & 2027, paying down $10M through operating cash and refinancing another $15M through a sales leaseback (which we still count as debt). Together these moves significantly destressed the company’s balance sheet.
- Jushi (JUSHF: OTC) has around $80M of debt maturing in 2024 and several unexpected cash flow issues. The company has Illinois dispensaries near the Missouri border that are losing sales to the lower-priced competition, and Its significant Virginia assets were built for the prospect of a new rec market that is now indefinitely delayed.
- The companies on the right side of the chart are in an enviable position. Their low leverage makes the potential acquirers of distressed assets in a target-rich environment. Moreover, additional financial flexibility is a valuable asset in the constrained capital markets facing the industry.