OUR 9TH YEAR OF PROVIDING PROPRIETARY CAPITAL MARKETS INTELLIGENCE ON THE CANNABIS / HEMP / PSYCHEDELIC SECTORS
Quick
Links
Past Charts
Home » Viridian Capital Chart of the Week: Where are Sector Leaders Trading Relative to Their 52-Week Highs and Lows?
Chart of the Week
Chart of the Week
The Viridian Capital Chart of the Week highlights key investment, valuation and M&A trends taken from that week’s Deal Tracker that we believe are impactful for investors, companies and acquirers.
Week ended 12/15/2023
Viridian Capital Chart of the Week: Where are Sector Leaders Trading Relative to Their 52-Week Highs and Lows?
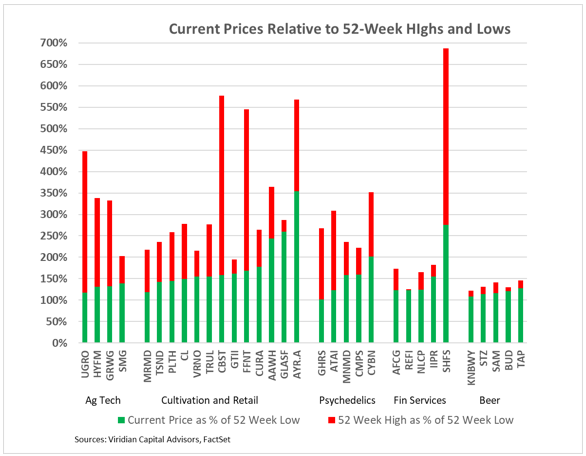
- This week’s Viridian Chart of the Week looks at the stock prices of the leaders in several cannabis sectors, including Agriculture Technology, Cultivation and Retail, Psychedelics, and Financial Services, relative to their 52-week highs and lows. The chart is arranged in increasing order of trading prices relative to 52-week lows within each sector.
- We have also included five top competitors in the beer industry to illustrate the relative performance of a key non-cannabis sector.
- The green bar shows the 12/15/23 stock price for each company as a percentage of its 52-week low. The top of the red bar indicates the 52-week high as a percentage of the 52-week low.
- At a median of 131% of its 52-week lows, the Agriculture Technology sector has slightly recovered from its lows.
- Cultivation has a median price of 159% of its 52-week lows and an extreme range from 118% for MariMed (MRMD: CSE) to 354% for AYR (AYR.A: CSE). Companies like AYR and Glass House, having traded up 260% and 354% from their 52-week lows, respectively, have a higher risk of underperformance if there is negative news on rescheduling or the SAFER Act. Glass House is also trading close to its 52-week high, giving us further pause. Several companies, including Cannabist (CBST: CBOE) and 4Front (FFNT: CSE), reacted with extra exuberance to the HHS rescheduling announcement, reaching highs 3.75-4x their current levels. These companies are in the weaker half of the Viridian Credit Tracker credit rankings, and we do not view the fact that they are trading at significant gaps to their 52-week highs as buying signals. Instead, we prefer companies like MariMed, TerrAscend, and Verano, which are top ten credits and have made significant operating improvements but are still trading at relatively low premiums to their lows.
- The Psychedelics sector is up a median of 158% from its 52-week lows and exhibits less volatility than the cultivation and retail sector primarily because it is not subject to the same potential upside catalysts.
- Financial services has the lowest median recovery from 52-week lows at only 124%, but it is also the sector trading closest to its 52-week highs with a median gap of only 41%.
- The Beer industry points to the future of cannabis. Beer is significantly more concentrated than cannabis, with industry leaders 5-50 times as large as the most significant cannabis company. Brands are well-established and command shelf space. Volatility is substantially lower than cannabis, with a difference between 52-week highs and less than 50% lows. Despite significantly lower growth, the beer companies on the chart trade at an average EV/ 2024 EBITDA of 9.3x vs 6.3x for cultivators.
- We view it as healthy that, with only a few exceptions, cannabis companies are trading at less than 75% premiums to their 52-week lows. Cannabis investors have learned the hard way that betting on regulatory or legislative reforms is risky. There has never been the degree of potential upside as there is now, yet investors are not getting too far out over their skis.