OUR 9TH YEAR OF PROVIDING PROPRIETARY CAPITAL MARKETS INTELLIGENCE ON THE CANNABIS / HEMP / PSYCHEDELIC SECTORS
Quick
Links
Past Charts
Home » Viridian Capital Chart of the Week: What’s the Right Way to Measure MSO Leverage?
Chart of the Week
Chart of the Week
The Viridian Capital Chart of the Week highlights key investment, valuation and M&A trends taken from that week’s Deal Tracker that we believe are impactful for investors, companies and acquirers.
Week ended 06/30/2023
Viridian Capital Chart of the Week: What’s the Right Way to Measure MSO Leverage?
- The credit quality of cannabis companies has taken center stage in 2023 as the equity capital markets remain shuttered and growth and operating profits remain constrained.
- Cannabis companies have rightfully turned to debt financing to plug the gap; however, this has increased leverage for the industry. We have previously argued that Debt/EBITDA over 3x is challenging to sustain in a 280e world. But Debt/ EBITDA is not the only indicator of leverage investors should look at.
- Debt/ EBITDA is more complicated than it appears. Should leases be included? Viridian Capital Advisors has always included leases in our debt calculations since before most leases were capitalized onto the balance sheet. They are fixed charges, and since they are often based on mission-critical equipment or facilities, the option to walk away from the lease is often not feasible. They should be considered debt.
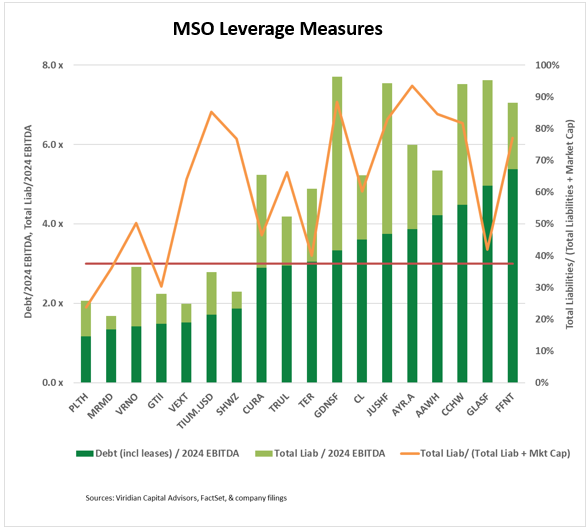
- The dark green bars indicate Total Debt, including leases to consensus 2024 EBITDA estimates. The red line is drawn at 3x, our general limit on long-term sustainability.
- The light green bars add other liabilities to the analysis. The top of the bars indicates total liabilities to EBITDA. Viridian believes it is essential to include total liabilities in the leverage definition to pick up tax and other debt-like liabilities not classified as debt. For example, Jushi (JUSHF: OTC) has $88.5M of tax liabilities on its balance sheet, representing 8.7 quarters of its most recent quarter’s tax expense. Goodness Growth (GDNS: CSE) has $75M of lease liabilities held as “Liabilities Held for Sale,” Verano (VRNO: CSE) has stated on its conference calls that it uses tax liabilities as a financing mechanism.
- Debt/EBITDA and Total Liabilities/EBITDA have critical problems as leverage indicators. One issue relates to the weakness of adjusted EBITDA: it is neither a good measure of profitability (adjusting out such things as equity-based compensation) nor a good measure of cash flow (neglecting interest expense, taxes, working capital changes, and CAPEX). Basing credit quality calculations on this measure is dangerous. Moreover, consensus analyst estimates are systemically optimistic and tend only to get updated at quarter ends.
- Viridian believes a market-based leverage indicator is a necessary addition to investors’ toolkits. The orange line depicts Total Liabilities/ (Total Liabilities + Market Cap.), the highest weighted of the four leverage ratios in the Viridian Capital Credit model. We believe this ratio to be the best single number indicator of overall credit quality. It directly measures the market’s view of the surplus of asset value over liabilities. For example, AYR’s (AYR.A: CSE) measure of 93% indicates that the market believes AYR’s assets are only worth 7% more than its liabilities. This indicator, in theory, considers everything that goes into equity valuation: regulation, profitability, growth potential, attractiveness as an acquisition candidate, etc. Daily changes in equity prices also inform it.
- However, like all statistics, this, too, has weaknesses. Consortium (TIUM: CSE) has reasonable Debt/EBITDA and Debt/ Total Liabilities but relatively high market leverage, which could mean that company’s stock is significantly undervalued. Similarly, Glass House Brands (GLASF: OTC) has very high Debt/EBITDA and Debt/Liabilities but more reasonable market leverage, potentially indicating market confidence in the company’s future that doesn’t show up in 2024 EBITDA estimates.
- Investors should focus on market leverage and track weekly changes in this ratio as effective early warning signs for their portfolios.