OUR 9TH YEAR OF PROVIDING PROPRIETARY CAPITAL MARKETS INTELLIGENCE ON THE CANNABIS / HEMP / PSYCHEDELIC SECTORS
Quick
Links
Past Charts
Home » Viridian Capital Chart of the Week: What Should MSO EBITDA Multiples Be?
Chart of the Week
Chart of the Week
The Viridian Capital Chart of the Week highlights key investment, valuation and M&A trends taken from that week’s Deal Tracker that we believe are impactful for investors, companies and acquirers.
Week ended 06/07/2024
Viridian Capital Chart of the Week: What Should MSO EBITDA Multiples Be?
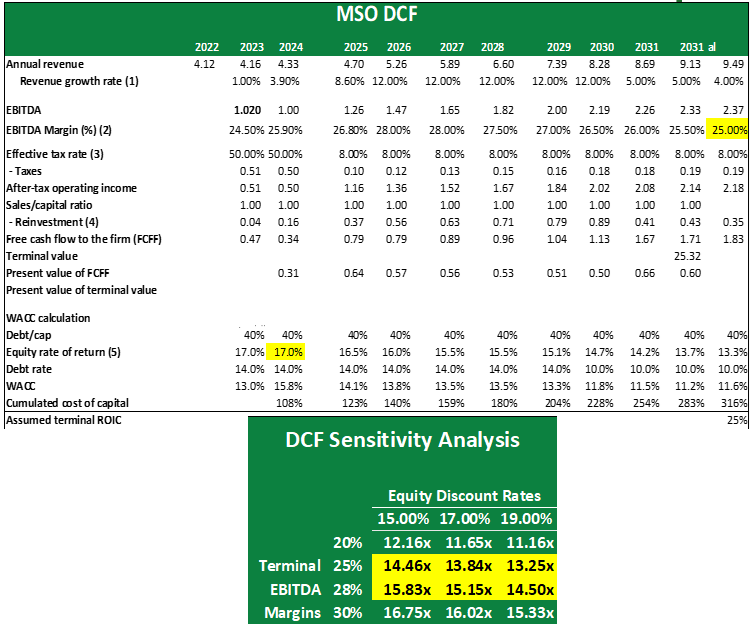
- Viridian created a discounted cash flow model (“DCF”) to calculate a range of theoretically supportable EV/EBITDA multiples, given analysts’ expectations for 2024-2025 and reasonable assumptions for the seven years after that.
- We based our model on a hypothetical $1 of EBITDA and generated a DCF valuation of that $1 to produce an EBITDA multiple.
- Assumptions:
- Revenue growth rates for 2024-2025 are consensus analyst estimates for the twelve largest MSOs.
- EBITDA Margins 2024-2025 are consensus analyst estimates. 2025 & 2026 margins are held constant at 28%, and afterward, margins advance or decline towards an assumed terminal margin, sensitized in the table. We believe it is appropriate to forecast decreasing EBITDA margins for post-legalization.
- Tax rates on EBITDA are assumed to be 50% for 2024. Then they are assumed to decline to 8% from 2025 onward based on combined federal and state tax rates of 27% on a company with assumed EBITDA margins of 28%, 3x Debt/EBITDA, and average depreciation/sales for the group of .1x sales.
- Required Reinvestment is driven by an assumed Sales/Capital ratio of 1.0x. This ratio is better than the .6x we measured in our recent study of capital intensity in the industry. We justify the lower marginal capital intensity based on near-term sales increases from new rec states where significant capital spending has already occurred.
- The range of equity discount rates considered is 15-19.0%, which we believe is reasonable given the increases that have occurred in the risk-free rate and balance sheet leverage for the group. Note that we have assumed that equity discount rates decline by approximately 250bp over time as capital costs become lower for the industry. This assumption is likely to be overly conservative, and we could easily see more significant capital cost declines.
- The resulting EBITDA multiples are shown in the Sensitivity Analysis Chart. Multiples range from 11.2x to 16.75x; however, we believe the most likely range to be between 13.25x and 15.8x. The group is currently valued at 7.8x consensus NTM EBITDA.
- The result confirms that the MSOs are cheap relative to their conservatively estimated intrinsic values; however, the ingrained investor skepticism regarding all cannabis regulatory developments and the absence of new capital in the market have delayed the upside move we still expect to develop.
- Other catalysts, like positive state actions in Florida and potentially Pennsylvania, a new Garland memo, the resurrection of the SAFER act, or encouraging developments in the Boies lawsuit, could meaningfully accelerate these gains. We believe a doubling of prices is a reasonable expectation as these catalysts unfold.