OUR 9TH YEAR OF PROVIDING PROPRIETARY CAPITAL MARKETS INTELLIGENCE ON THE CANNABIS / HEMP / PSYCHEDELIC SECTORS
Quick
Links
Past Charts
Home » Viridian Capital Chart of the Week: What SHOULD EBITDA Multiples Be?
Chart of the Week
Chart of the Week
The Viridian Capital Chart of the Week highlights key investment, valuation and M&A trends taken from that week’s Deal Tracker that we believe are impactful for investors, companies and acquirers.
Week ended 08/14/2023
Viridian Capital Chart of the Week: What SHOULD EBITDA Multiples Be?
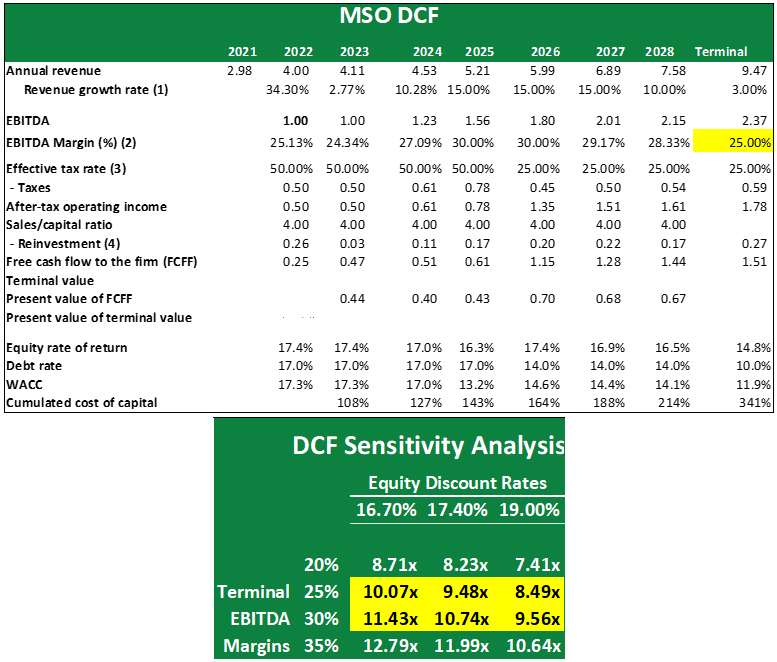
- We created a discounted cash flow model (“DCF”) to calculate a range of theoretically supportable EV/EBITDA multiples, given analysts’ expectations for 2022-2024 and reasonable assumptions for the seven years after that.
- We based our model on a hypothetical $1 of EBITDA and generated a DCF valuation of that $1 to produce an EBITDA multiple.
- Assumptions:
-
- Revenue growth rates 2023-2024 are consensus analyst estimates for the ten largest MSOs.
- EBITDA Margins 2023-2024 are consensus analyst estimates. 2025 & 2026 margins are held constant at 30%, and afterward, margins decline towards an assumed terminal margin, sensitized in the table. We believe it is appropriate to forecast decreasing EBITDA margins for post-legalization.
- Tax rates are assumed to be 50% on EBITDA from 2022 to 2025 and then are assumed to decline to 25% based on 280e relief.
- Required Reinvestment is driven by an assumed Sales/Capital ratio of 4.0x. This ratio is derived from the observation of data compiled by Professor Aswath Damodaran of NYU. A 4.0x multiple implies extremely low capital intensity.
- The range of equity discount rates considered is 16.7-19.0%, which we believe is reasonable given the increases that have occurred in the risk-free rate and balance sheet leverage for the group. Note that we have assumed that equity discount rates decline by approximately 200bp over time as capital costs become lower for the industry. This assumption is likely to be overly conservative, and we could easily see more significant capital cost declines.
- The resulting EBITDA multiples are shown in the Sensitivity Analysis Chart. Multiples range from 7.4x to 12.8x; however, we believe the most likely range to be between 9.5x to 11.4x. The group is currently valued at 6.5x consensus 2023 EBITDA. Estimated multiples have contracted from 11-16x when we first did this exercise in April 2022. The decline is attributable to commoditized price compression, inflationary cost increases, higher overall rates, and higher industry leverage.
- The benefit of making all assumptions explicit is that investors can utilize their assumptions for future growth and margins to determine an appropriate multiple.
- The result confirms that the MSOs are cheap relative to their conservatively estimated intrinsic values; however, industry economics and market rates have limited the upside from a year ago.
- Our model is available to download upon request. DM us, and we will email it to you for further exploration.