OUR 9TH YEAR OF PROVIDING PROPRIETARY CAPITAL MARKETS INTELLIGENCE ON THE CANNABIS / HEMP / PSYCHEDELIC SECTORS
Quick
Links
Past Charts
Home » Viridian Capital Chart of the Week: Liquidity and Leverage Ratios by Cannabis Sector
Chart of the Week
Chart of the Week
The Viridian Capital Chart of the Week highlights key investment, valuation and M&A trends taken from that week’s Deal Tracker that we believe are impactful for investors, companies and acquirers.
Week ended 03/03/2023
Viridian Capital Chart of the Week: Liquidity and Leverage Ratios by Cannabis Sector
-
- Viridian Capital Advisors tracks valuation and credit metrics for about 350 public companies weekly. Each company is assigned to one of 12 industry subsectors since valuation and credit statistics vary significantly between sectors.
-
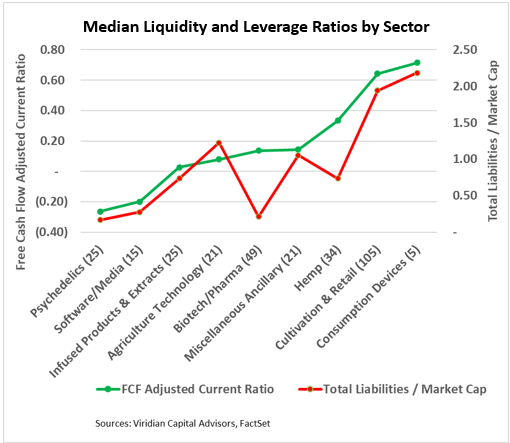
- The graph shows the liquidity and leverage ratios of the cannabis subsectors. We have eliminated three sectors from the chart: Consulting, Real Estate, and Investment/M&A. Consulting has only four members, all of which have market caps under $10M. The other two groups are chiefly cannabis lenders and SPACs, whose balance sheets are not comparable to the other groups.
-
- The graph shows two of the most significant ratios employed in the Viridian Capital Credit Tracker Scoring Model.
- The free cash flow adjusted current ratio is our top liquidity ratio as it updates the classic current ratio using cash flow information. The current ratio has gone out of favor in corporate credit analysis because most sizeable corporations maintain standby credit lines to augment their liquidity. The ratio is far more helpful in cannabis, however, since few cannabis companies, even non-plant touching ones, have bank liquidity lines. We add annualized free cash flow to the numerator to adjust for cash burn. Surprisingly, the median value for every sector is below 1x, indicating that over half of our sample companies will likely need additional financing during 2023.
- Total liabilities to market cap is our most relied-upon leverage ratio as it gives a market-based view of the coverage of asset values over liabilities. Total liabilities are used instead of total debt because they include essential items like taxes payable and lease liabilities. The graph shows that sectors with low median liquidity tend to exhibit lower market leverage.
- The Psychedelics and Software sectors have the lowest liquidity with the most pressing need for additional financing. Luckily, both sectors are non-plant touching and have attracted institutional capital. Agriculture Technology is also non-plant-touching but has significantly higher leverage, making its .08x liquidity ratio more troubling.
- The graph shows two of the most significant ratios employed in the Viridian Capital Credit Tracker Scoring Model.
-
- The Cultivation & Retail sector has one of the highest leverage stats, partially because its hard assets have increasingly allowed it to utilize debt financing. While the median leverage stat of 1.94x is reasonable, we note that over 25% of the 105 companies have leverage measures over 7.9x, indicating significant stress/distress.