OUR 9TH YEAR OF PROVIDING PROPRIETARY CAPITAL MARKETS INTELLIGENCE ON THE CANNABIS / HEMP / PSYCHEDELIC SECTORS
Quick
Links
Past Charts
Home » Viridian Capital Chart of the Week: Values in Under Covered Cannabis Companies?
Chart of the Week
Chart of the Week
The Viridian Capital Chart of the Week highlights key investment, valuation and M&A trends taken from that week’s Deal Tracker that we believe are impactful for investors, companies and acquirers.
Week ended 07/14/2023
Viridian Capital Chart of the Week: Values in Under Covered Cannabis Companies?
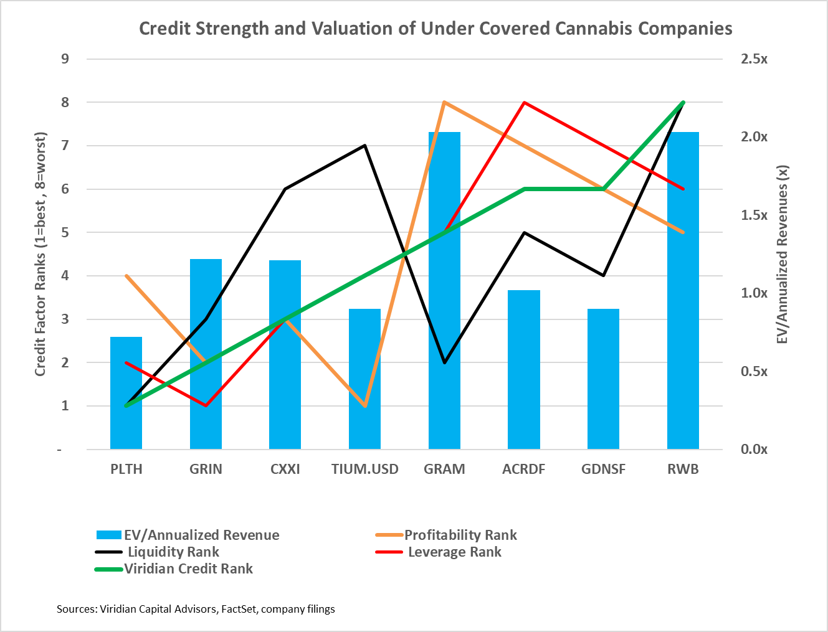
- The chart explores the relative credit quality and valuation of the eight public U.S. cannabis companies with market caps over $20M and coverage from fewer than two sell-side analysts.
- The green line shows the Viridian Capital credit ranking of the group ranging from one (best) to eight (worst). The red, purple, and orange lines represent the Viridian model leverage, liquidity, and profitability sub-rankings. The blue bars depict enterprise value / annualized revenues.
- Although we are uncomfortable with the companies’ credit profiles on the right-hand side of the chart, the companies on the left appear to be investable and well-priced.
- Planet 13 (PLTH: CSE)(PLNHF: OTC) is the cheapest company of the group based on EV/Revenues and the top-ranked credit, largely due to its debt-free position and strong liquidity. However, profitability has been poor, with single-digit EBITDA margins for 2022 and YTD 2023. Operating cash flow was negative $5.2M for the first quarter, and PLTH has upcoming capital spending needs of $10M-$20M, mostly to complete its Illinois and Florida buildouts.
- Grown Rogue (GRIN: CSE)(GRUSF: OTC) trades at 1.22x annualized revenues and ranks as the second-best credit of the group, with the best leverage, second-best profitability, and third-best liquidity. GRIN has very little debt and has had positive operating cash flow for the last seven quarters. The company has proven to succeed despite operating in the difficult Oregon market.
- C21 Investments, trading at 1.21x annualized revenues, ranks as the third strongest credit in the group according to the Viridian Capital credit model. The company has an impressive record of 13 consecutive quarters of positive free cash flow and virtually no debt, fully paying off its senior secured notes from internal cash flows. C21 is another company proving that a small SSO can succeed even in a challenging market (Nevada).
- Cansortium (TIUM.U: CSE)(CNTMF: OTCQX) ranks as the fourth strongest credit in the group. The company has a good position in Florida and has one of the three available licenses in Texas. Unlike the top three credits, Cansortium carries a significant amount of debt at 3.5x debt/ mkt cap and 2.44x debt (including leases) to annualized adjusted EBITDA. We believe the company has solid asset value coverage and trades at only .86x EV/annualized revenues and 1.95x EV/ annualized adjusted EBITDA.
- The four companies on the right of the graph all have negative cash flow from operations, high debt/mkt cap, and challenged profitability. Of the four, we are most intrigued by Goodness Growth (GDNS: CSE)(GDNSF: OTCQX) because of the optionality of its New York business and our perception that the company is a logical takeout candidate. Trading at .9x EV/annualized revenue GDNS may be a reasonable speculation.