OUR 9TH YEAR OF PROVIDING PROPRIETARY CAPITAL MARKETS INTELLIGENCE ON THE CANNABIS / HEMP / PSYCHEDELIC SECTORS
Quick
Links
Past Charts
Home » Top 5 and Bottom 5 Cash Flowing Companies in the Third Quarter
Chart of the Week
Chart of the Week
The Viridian Capital Chart of the Week highlights key investment, valuation and M&A trends taken from that week’s Deal Tracker that we believe are impactful for investors, companies and acquirers.
Week ended 11/28/2022
Top 5 and Bottom 5 Cash Flowing Companies in the Third Quarter
-
- Participants at the recent MJBIZ conference discussed cash flow far more regularly than growth. A broad range of companies discussed instituting cost controls, tightening working capital management, and adopting stricter capital budgeting. This change of focus makes great sense given the constrained cannabis capital markets, which are the most challenging we can remember.
-
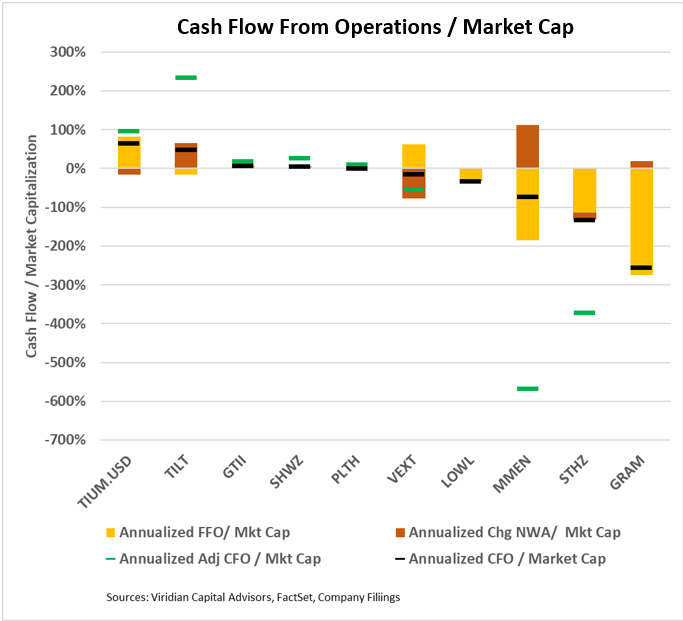
- We reviewed the third-quarter cash flow of the 27 U.S. Cultivation & Retail sector companies in the Viridian Value Tracker database with market caps over $25M. The left side of the graph shows the five companies with the best relative cash flow, while the right side shows the five companies with the weakest cash flow measures. Note that each cash flow measure was annualized and divided by market capitalization to put all companies on a standard scale.
-
- The yellow bar on the graph shows each company’s funds from operation, defined as Net Income plus non-cash charges such as depreciation & amortization, valuation reserves and write-offs, and stock-based compensation. Many lenders focus on this number because cash used for working capital buildup is, in theory, “self-liquidating.”
-
- The orange bars depict sources/uses of cash from changes in working capital. We would generally expect these to be uses of cash for most cannabis companies since revenues are generally increasing.
-
- The black line shows the cash flow from operations (the sum of the yellow and orange bars), the most important single measure on the cash flow statement because it doesn’t change when companies take write-offs, adjust their inventory valuation, depreciation policy, etc.
-
- The use of income taxes payable as a borrowing source has become widely debated. The green line shows the cash flow from operations to market cap after adjusting cash flow to achieve a 90-day tax accrual. Some companies like Tilt Holdings (TILT: CSE) would benefit from delaying their payment of taxes. Most other companies, especially those on the right side of the graph, already have more than 90 days of outstanding taxes. StateHouse (STHZ: CSE) and TPCO (GRAM: CSE) have annualized negative cash flow from operations above their market caps, even before adjusting for taxes and subtracting Capex.
-
- Investors are paying more attention to cash flow. Several companies, like Cansortium (TIUM: CSE) and Tilt, achieved solid cash from operations in the third quarter, while others displayed significant deficits combined with relatively large tax liabilities.